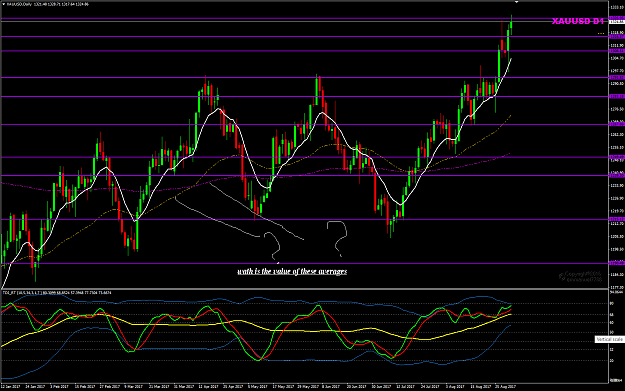
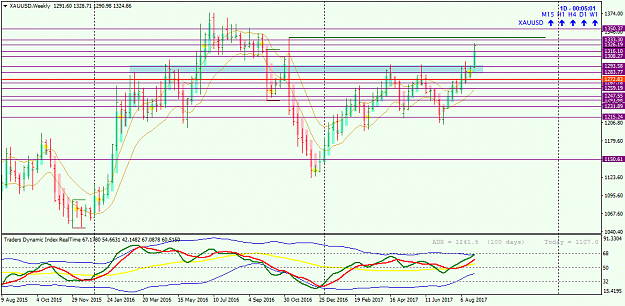
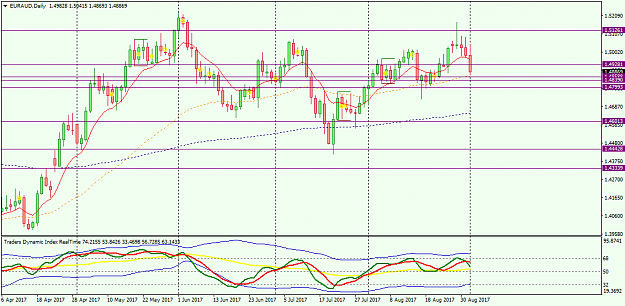
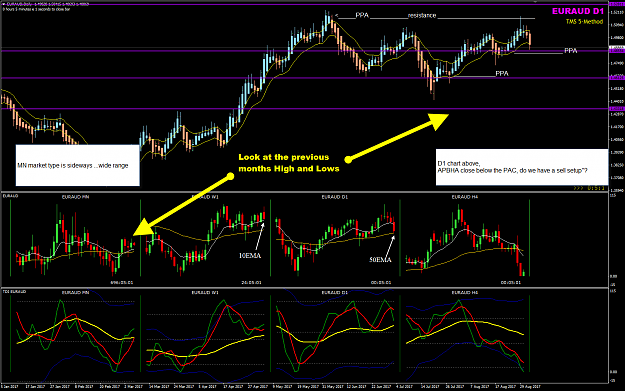
DislikedHere is an example which I missed last month. I saw that but my hands were quite full with other trades. Look at D1 chart and look at previous month high or lows and look for empty space to buy or sell into. Use those 10EMA, 50EMA and 200EMA on D1 chart to help you visualize the market. Look at MN and W1 charts with their respective 10EMA and 50EMA. Do these top down analysis and look for trade opportunities in September and learn to trade the D1 chart either with SE/SE or with ME/SE or ME/ME. {image} Look at the MN and W1 charts above, what price...Ignored
FX newbie talk ...
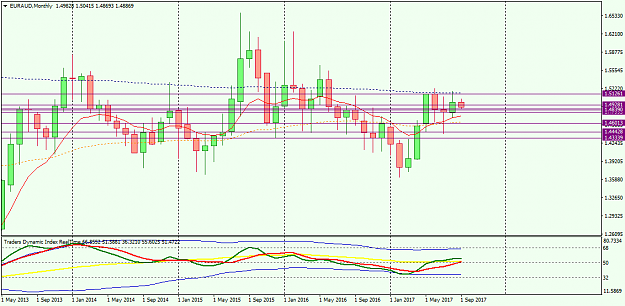
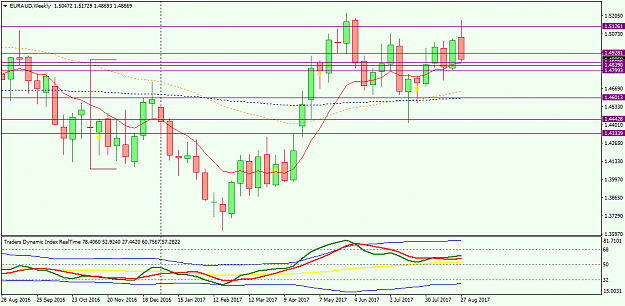
On MN and W1 we can see clearly a down trend, and I would only take short trades. Big empty space?
On the D1, it is still bellow the EMA (bellow 200EMA on the main chart), suggesting to keep on the trade and prepare for the BUILD and RUN phases as it tested the May low (new resistence).
Thanks for this chart.
RSP