Disliked{quote} Thank you so much Emmanuel that would be great. Its very much appreciated. I use Fibonacci weekly pivots the same as Likica and Davit use.Ignored
Hi Lisa,
I am a stock market trader since 1980's. I learned the use of the Standard Pivot from a floor trader. I know many professional traders use the Standard Pivot.
When I started in forex trading, I also use the Standard Pivot for a few years. Then in 2013 a small group of TMS traders got together and we all did some studies, back-testing, forward testing and decided that we develop TMS to follow the way Big E traded using recent price action and look for the support and resistance and how he looked at the price behaviour around the price round numbers. In particular, we noted that pick setups which are often around the BRN '00'levels and also the RN'50' level.
We were looking at consistency in our trading approach and one of the problem we found was there are different formulae used in the pivot calculations. There is the Standard Pivot, then there are the Woodie, Camarilla and Fibonacci pivots. The other problem is also that different brokers have different start of day and also different start of week. This different start of day will mean different Pivots Point and its Support and Resistance levels. The differences may be small but it also lead to confusion with many inexperience traders and they end up not able to trade well.
Forex is unlike Stock market which closes every day and reopen the next day. The stock market open and close times are fixed hence the pivots calculation will be consistent with the previous Day OHLC for day traders.
Another problem we discovered is that there are so many different versions of pivots indicators in public forums and many are flaw. One good example is the use of the Weekly Pivot. Some inexperienced traders use the current Week Pivot and look back into history charts and look for support and resistance. These rookie traders did not realised that the current week pivot is calculated using the previous Week' Open, High, Low and Close price data and the Pivot Point and S&R levels are only good for the current week trading. All historical pivot points and its corresponding S&R levels are very different.
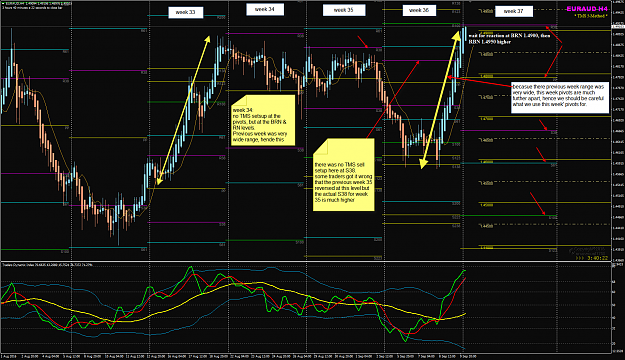
Below chart example what the true weekly pivot is and the second chart a flawed version of the weekly pivots which draws the current week WPP and S&Rs into the history.
The other problem is also that since the WPP is based on the previous week’s data – High and Low, in a very narrow range week, the following week’s PP and S&R ae very close and these will not give optimum placement of exits. In the other extreme when the previous week is very wide range, then the following week pivots and S&R levels become very far apart making exits planning unrealistic.
The conclusion is that for optimum trading using TMS, we use the price levels BRN and RN and look for previous price action for historical support and resistance. This will help us keep our charts free from clutter and all the fancy colours lines which give traders unnecessary visual bias which is a hindrance. The emphasis should be on learning to see real price action at support and resistance with better clarity on our charts. What is more important is also TMS is a trend trading, we trade only when there is a reversal seen with price action at support and resistance. We do not trade based on assumption that the market will reversal at some preferred pivot level and the use averaging down as the market did not reverse and we suffer floating losses/drawdown which tie down our trading capital for unknown length of time. We must at all times learn to use our trading capital wisely, “make our money work for us” to generate returns and not let our money be used by the market.
In Likica M30 thread, the Weekly Pivot she posted in the zip files is a good one to use. See chart below. The left chart is the good one. The right chart is wrong.
Attached Image (click to enlarge)
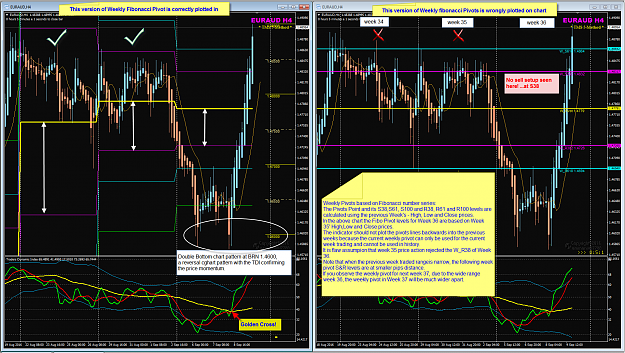
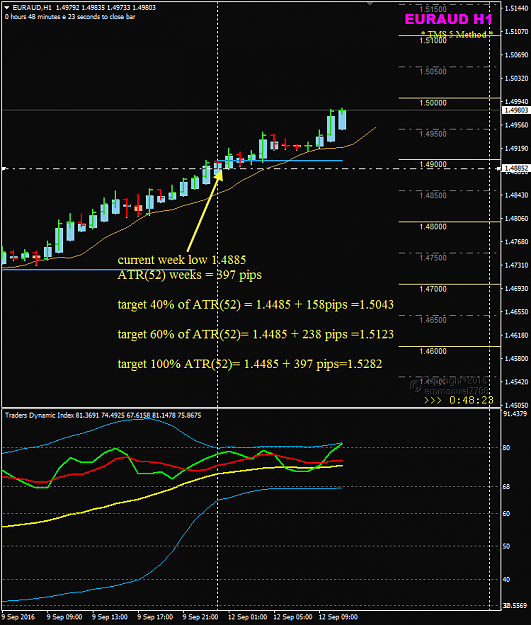
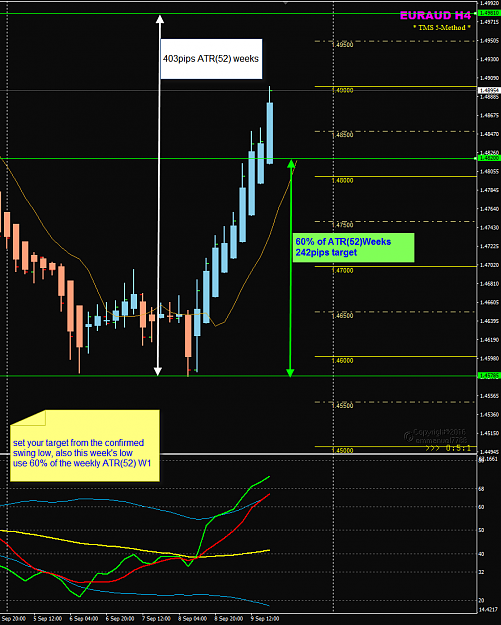
From my experience, it is better to know the 52-weeks ATR and use this for trade planning and exits (take profits). This method s more effective to get an optimum exits with realistic target profits. - 40% , 60% and 100% of the ATR(52) weeks when we trade the H4 chart. Note that EUDAUD has 2 weeks narrow range in Week 34 and 35, the pivots in week 36 are too close and not optimum for trade exits planning.
Attached Image (click to enlarge)
Hope this helps.
Good Trading next week 37.
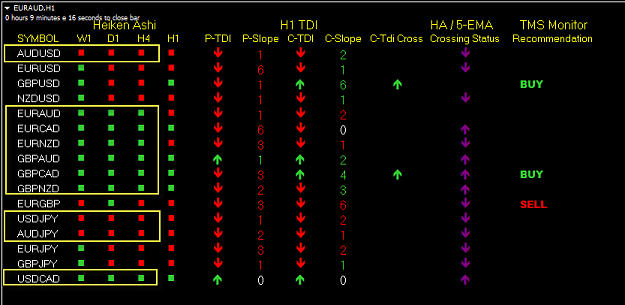
We follow EURAUD with ME/ME...
Honesty is a very expensive gift. You wont find it in cheap people.WBuffett
1