• Home
  • Forums
  • Trades
  • News
  • Calendar
  • Market
  • Brokers
  • Login
  • Join
  • 12:25am
Menu
  • Forums
  • Trades
  • News
  • Calendar
  • Market
  • Brokers
  • Login
  • Join
  • 12:25am
Sister Sites
  • Metals Mine
  • Energy EXCH
  • Crypto Craft

Options

Bookmark Thread

First Page First Unread Last Page Last Post

Print Thread

Similar Threads

Trading Made Simple the right way, and other trading lessons 329 replies

Monitor for 'Trading Made Simple' system 562 replies

Indicators for the 'Trading Made Simple' system 343 replies

MTF Indicators for the 'Trading Made Simple' system 241 replies

Trading Made Simple system follower - Thanks to eelfranz 9 replies

  • Trading Systems
  • /
  • Reply to Thread
  • Subscribe
  • 65,964
Attachments: Trading Made Simple
Exit Attachments
Tags: Trading Made Simple
Cancel

Trading Made Simple

  • Last Post
  •  
  • 1 27262727Page 272827292730 7156
  • 1 Page 2728 7156
  •  
  • Post #54,541
  • Quote
  • Mar 5, 2015 11:08am Mar 5, 2015 11:08am
  •  MrRijk
  • | Joined Feb 2015 | Status: Member | 170 Posts
Hi Everyone i am new here, can anybody tell ma what is the setting of (ema/ma) in the chart ? not the TDI indicator ,
i mean the one with the Heiken ash bars??
Thanks, regards
Human beings are members of a whole, In creation of one essence and sol.
 
 
  • Post #54,542
  • Quote
  • Mar 5, 2015 11:15am Mar 5, 2015 11:15am
  •  mokuro89
  • Joined Mar 2015 | Status: Member | 449 Posts
Quoting MrRijk
Disliked
Hi Everyone i am new here, can anybody tell ma what is the setting of (ema/ma) in the chart ? not the TDI indicator , i mean the one with the Heiken ash bars?? Thanks, regards
Ignored

  1. Post 50,214

if you talking about the PAC, is the Synergy_PRO_ABP


  • Post #54,543
  • Quote
  • Mar 5, 2015 12:09pm Mar 5, 2015 12:09pm
  •  WDays
  • Joined Oct 2012 | Status: Member | 1,813 Posts
Re-entered short after the pullback to the TL, got +28 pips on the first one, targetting 1.0965 here on this second one... I may close earlier though. edit: actually moved the TP to b/e and I'm heading out...
Attached Image (click to enlarge)
Click to Enlarge

Name: EURUSDM15.png
Size: 45 KB
 
 
  • Post #54,544
  • Quote
  • Mar 5, 2015 12:21pm Mar 5, 2015 12:21pm
  •  mokuro89
  • Joined Mar 2015 | Status: Member | 449 Posts
A valid break of master candle would be on the Close of bar outside of the range, or just pass throught it?
 
 
  • Post #54,545
  • Quote
  • Mar 5, 2015 4:55pm Mar 5, 2015 4:55pm
  •  emmanuel7788
  • Joined Nov 2008 | Status: Member | 42,937 Posts
Quoting mokuro89
Disliked
A valid break of master candle would be on the Close of bar outside of the range, or just pass throught it?
Ignored
Mokuro,

First, I want to make it clear how the Master Candle(3) is used in TMS trading.
The MC(3) is to help us see market consolidation and we must have in our trading plan what to do during market consolidation.
For example, when we see a MC(3) on our D1 chart, we do not trade until the market breakouts out of that D1 MC(3) range high-low. We can only trade in the lower timeframes, H4 and H1 according to other rules we have for trading in those timeframes. Remember to use the D1 MC(3) high low as support and resistance in lower timeframes along with other support and resistance methods you use.

To answer your question,
we must see a that the market price must close either above or below that MC(3) candle high-low and determine that the market has move out of that consolidation range.
It is important always have a big picture of the market because some of the MC breakout candles will not result in a new trend or trend continuation. How do filter this? Always look at the big picture and look at the recent 10 to 13 candles (both the real price bars and the APB) study the price action and its momentum shown by the TDI. Then to look at the next higher timeframe trend or bias. This will help us pick the high probability direction or wait for a further move.

Next thing we need to do is to look at the MC(3) consolidation range and compare that range with the average traded range of that timeframe. Study your history charts and learn to see this and find the answer. Remember , keep it simple and do not go too deep into other things, just study the market average traded range of the timeframe you trade. Then use this information for your trading.

Sounds like a lot to do and is complicated. With lots of screen time and deep practice, some of these work you do will eventually become your skills which you will need to become a super trader.

Keep working at developing those skills.

regards,
Honesty is a very expensive gift. You wont find it in cheap people.WBuffett
 
 
  • Post #54,546
  • Quote
  • Mar 5, 2015 5:00pm Mar 5, 2015 5:00pm
  •  emmanuel7788
  • Joined Nov 2008 | Status: Member | 42,937 Posts
Quoting Pervis
Disliked
This is some trade I took today. 3 wins & 1 lose trade on EA (which I do not post it up because I don't see any benefit when see the losing trade) As usually, I will close all trade before news announcement but today I stay on my computer and follow these trade so I keep it moving. In my opinion I will close the trade asap if I see the price pull back {image} {image} {image}
Ignored
Excellent trades...

Simple, clean and well executed the TMS 5-Method way.

Can only be done with DISCIPLINE in all departments of trading by a proficient trader. I LIKE
Honesty is a very expensive gift. You wont find it in cheap people.WBuffett
 
 
  • Post #54,547
  • Quote
  • Mar 5, 2015 5:04pm Mar 5, 2015 5:04pm
  •  emmanuel7788
  • Joined Nov 2008 | Status: Member | 42,937 Posts
Quoting nods80
Disliked
{quote} Emm how did you do in this? was your target hit?
Ignored
Hi Nods,

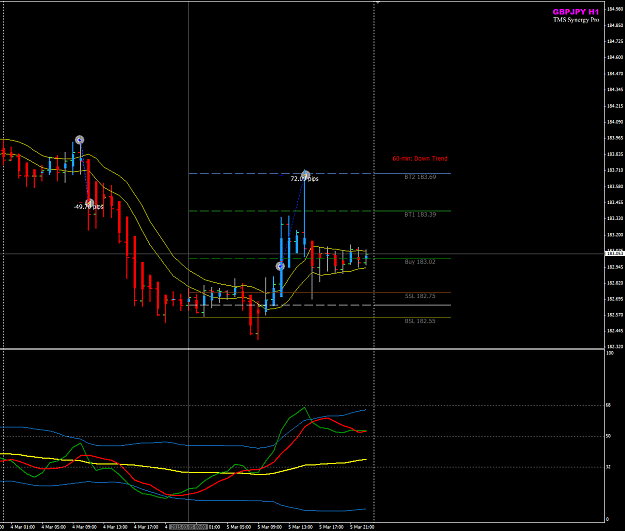
It was set and forget trade.
Placed on TP on the DOTS BT2 level and since I had my SL move to BE+, I went to bed.
It hit my TP +72pips and recovered my previous day loss -50pips.

Attached Image (click to enlarge)
Click to Enlarge

Name: GBPJPY H1 trades 4 5 Feb.png
Size: 36 KB


regards,
Honesty is a very expensive gift. You wont find it in cheap people.WBuffett
 
 
  • Post #54,548
  • Quote
  • Mar 5, 2015 5:12pm Mar 5, 2015 5:12pm
  •  emmanuel7788
  • Joined Nov 2008 | Status: Member | 42,937 Posts
Quoting mkfx
Disliked
{quote} are all 3 tp with equal lots.. thanks
Ignored

Hi mkfx,

Yes, when I trade using Multi-Lots positions, the trades must be of same position size and calculated with the risk %.

It is about 3 things - Risk and R-Multiple, Position Sizing and Expectancy that I want to share here in TMS trading.

regards,
Honesty is a very expensive gift. You wont find it in cheap people.WBuffett
 
 
  • Post #54,549
  • Quote
  • Mar 5, 2015 5:20pm Mar 5, 2015 5:20pm
  •  nods80
  • Joined Nov 2014 | Status: Member | 591 Posts
Quoting emmanuel7788
Disliked
{quote} Hi Nods, It was set and forget trade. Placed on TP on the DOTS BT2 level and since I had my SL move to BE+, I went to bed. It hit my TP +72pips and recovered my previous day loss -50pips. {image} regards,
Ignored
Good job I was pushing it and had my TP2 set higher and got stopped for BE +5 on the 2nd half of the order, and +30 on the first tp. That trade frustrated me a bit.
Intelligence is the ability to adapt to change. Stephen Hawking
 
 
  • Post #54,550
  • Quote
  • Mar 5, 2015 5:56pm Mar 5, 2015 5:56pm
  •  emmanuel7788
  • Joined Nov 2008 | Status: Member | 42,937 Posts
Quoting rupasi
Disliked
{quote} Eman, thanks so much for your training! I'm working on deepening my understanding of MC per your last message directing us to a pdf. Can you direct me to some language about WRB, Mother Bar and how they relate to the MC, IB? Thanks!
Ignored
Hi rupasi,

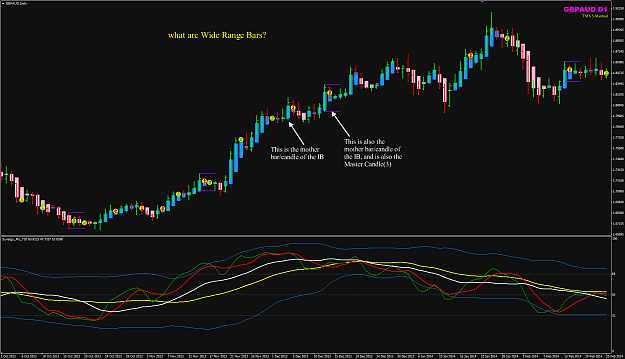
Here a pic to show what Mother Bar/Candle is in relation to the Inside Bar. I did not create the term Mother Bar/Candle. It is used in books and most printed resources about trading price patterns.
A small group of active TMS traders studied price patterns for many months and we went on to develop TMS-II which incorporated the MC(3) and IB to help us see market consolidation easier.

WRB = Wide Range Bars.
WRB Analysis WRBA is another popular technical analysis methodology available. That has to do with Volume Spread Analysis or VSA study.
I will not want to talk about the details now as there are many new traders joining this thread recently as it could lead to confusion and make learning to trade and to trade with TMS 5-Method complicated for these new members. I know there are many more experienced traders here and also very active TMS traders, they know what WRBA and VSA, and are and beginning to apply that in their trading with TMS. Perhaps , we can move ahead and develop TMS-III together in 2015 as a new project.

But, we can simply look at each price bar' its high-low range and compare that range to the recent 3 to 5 bars, if the current price bar has the highest range when compare to the most recent 3 to 5 bars, start to question why?
- Look around for closeby support and resistance.
- Check the calendar timing of news/data release if you are on H1/H4 charts.
- Remember the TMS 5-Method entry rules and the chart conditions. Look at those things what eelfranz mentioned in his post#261 and post#647. You will find good explanation and answer.

Attached Image (click to enlarge)
Click to Enlarge

Name: WRB MC IB explain.png
Size: 58 KB


regards,
Honesty is a very expensive gift. You wont find it in cheap people.WBuffett
 
 
  • Post #54,551
  • Quote
  • Edited 6:46pm Mar 5, 2015 6:08pm | Edited 6:46pm
  •  emmanuel7788
  • Joined Nov 2008 | Status: Member | 42,937 Posts
Quoting nods80
Disliked
{quote} Good job I was pushing it and had my TP2 set higher and got stopped for BE +5 on the 2nd half of the order, and +30 on the first tp. That trade frustrated me a bit.
Ignored

Hi nods,

some thoughts about that GJ trade.
we were trading against a very bearish previous D1 4 Feb.
but we have the Monthly bias and the Weekly still in our favour.
quite wide range in MN and W1, so that is good to trade with TMS when market type is sideways wide range. We can buy and sell within this wide range.
we saw yesterday D1 made a new low but it is not confirm new low until I see that D1 candle high taken out, that would be good to resume weekly buy trading.
anyway, the TDI will support what we see in the price action.

regards,
Honesty is a very expensive gift. You wont find it in cheap people.WBuffett
 
 
  • Post #54,552
  • Quote
  • Mar 5, 2015 6:35pm Mar 5, 2015 6:35pm
  •  emmanuel7788
  • Joined Nov 2008 | Status: Member | 42,937 Posts
Quoting shay14
Disliked
{quote} Hi emmanuel, do you have the link for DOTS levels ? and are they similar to support and resistance?
Ignored

Hi shay,
Sorry I missed your post yesterday.

You will find various version of DOTS indicator here in this thread and other thread too.
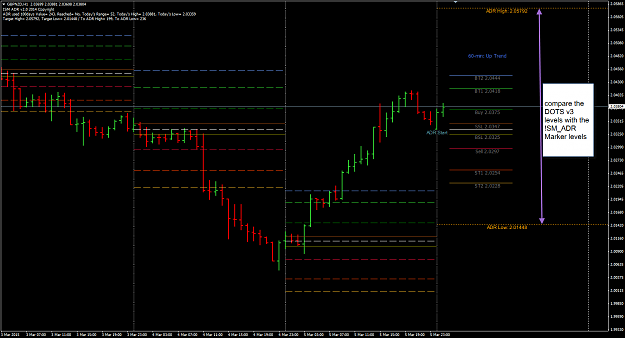
I compare the DOTS v3 and !SM_ADR Marker (default set to 30 days).
I find the DOTS levels rather conservative on many trading days therefore I prefer use the volatility / ADR method to calculate price levels and use these levels for potential exits levels for both stop loss and take profits. There is no holy grail in whatever we do. We need to find a way which we have tested over a longer time and be comfortable with its results and we follow that consistently with our own set of disciplined rules and money management strategy.

Look at the chart1 below where I compare today' 6 Feb DOTS v3 calculated levels and the range of the !SM ADR set to 30-days.

Chart 1
Attached Image (click to enlarge)
Click to Enlarge

Name: DOSTS levels vs iSM ADR marker.png
Size: 43 KB

However,
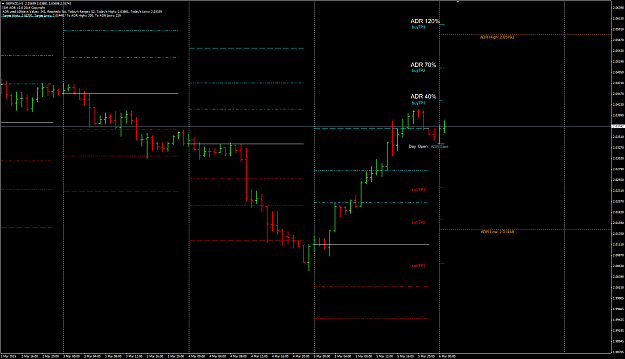
If you take the range set by the !SM ADR Marker 30-days, and use a multplier to determine the range levels 40%, 70% and 120%,
you can determine your own levels for trading with TMS.

Chart2 below
Attached Image (click to enlarge)
Click to Enlarge

Name: ADR 30 days multiplier.png
Size: 41 KB


What do you think about this?

regards,
Honesty is a very expensive gift. You wont find it in cheap people.WBuffett
 
 
  • Post #54,553
  • Quote
  • Edited 7:20pm Mar 5, 2015 7:18pm | Edited 7:20pm
  •  Erebus
  • Joined Jul 2011 | Status: Member | 7,290 Posts
Quoting emmanuel7788
Disliked
{quote} Hi shay, Sorry I missed your post yesterday. You will find various version of DOTS indicator here in this thread and other thread too. I compare the DOTS v3 and !SM_ADR Marker (default set to 30 days). I find the DOTS levels rather conservative on many trading days therefore I prefer use the volatility / ADR method to calculate price levels and use these levels for potential exits levels for both stop loss and take profits. There is no holy grail in whatever we do. We need to find a way which we have tested over a longer time and be comfortable...
Ignored
I've had similar thoughts, mainly that the DOTS acts more like a Pivot indicator based only on previous days' price action which might explain the narrow range it sometime displays?

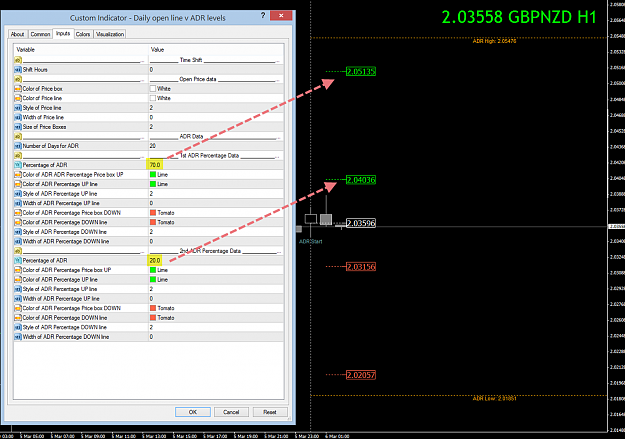
Even went so far as to get CJA to program the Daily Open Line indicator to display optional lines at user adjustable percentage away from the daily open - the picture will explain much easier.

Basically, a possible entry line and projected target - I don't like the DOTS using 2 targets, it's too easy to claim success even it only hits the first; I'm an all or nothing trader

In the chart example, I have set the close % to 20, and the target to 70% - therefore a possible trade captures 50% of the ADR, is my math correct?

You can always trail if the trade get going, target the ADR indicator instead as it dynamically updates as price moves.

Some may find this useful, remember, what doesn't go up, must come down, have a great NFP, see ya, John

PS: I'll monitor that chart during today's session and post any findings at the close / weekend.
Attached Image (click to enlarge)
Click to Enlarge

Name: 6-03-2015 10-05-13 AM.png
Size: 328 KB
Attached File(s)
File Type: ex4 Daily open line v ADR levels.ex4   45 KB | 743 downloads
Don't believe everything that you THINK
BuyDips,SellRips Return This Week: na
 
 
  • Post #54,554
  • Quote
  • Mar 5, 2015 8:32pm Mar 5, 2015 8:32pm
  •  haydo147
  • | Joined Sep 2014 | Status: Member | 167 Posts
Hi everyone,

I have a question for pac users.

Lets say were looking for a short opportunity and all the signals are there (stoch, tdi etc)
When we see price close beyond the pac is that our entry? Even if price starts to pull back slightly on the next candle do we trust the signals? Trust the break of the pac?

Ive made some good trades and feel quite comfortable analyzing a pairs direction for the longer teem and am fine with picking entry points i think my biggest issue is my own mind.

I miss some great opportunities because i see a slight pullback in price and am noy sure whether to wait for the close or not

Most of the times when i wait for a close (1hr) i miss majority of the move and get in a bad price.
 
 
  • Post #54,555
  • Quote
  • Mar 5, 2015 8:56pm Mar 5, 2015 8:56pm
  •  H0rus
  • | Joined Feb 2015 | Status: Member | 32 Posts
Quoting haydo147
Disliked
Hi everyone, I have a question for pac users. Lets say were looking for a short opportunity and all the signals are there (stoch, tdi etc) When we see price close beyond the pac is that our entry? Even if price starts to pull back slightly on the next candle do we trust the signals? Trust the break of the pac? Ive made some good trades and feel quite comfortable analyzing a pairs direction for the longer teem and am fine with picking entry points i think my biggest issue is my own mind. I miss some great opportunities because i see a slight pullback...
Ignored
That's your call. In my newbie opinion, if you want to trade price action better take the pullback opportunities, however beware with big spikes counter pullbacks. Has SJ use to say "that's no man's land". But that's also the essence of price action traders. I guess you must judge well. No hesitations nor itchy fingers.

Regards
 
 
  • Post #54,556
  • Quote
  • Mar 5, 2015 9:16pm Mar 5, 2015 9:16pm
  •  haydo147
  • | Joined Sep 2014 | Status: Member | 167 Posts
Quoting H0rus
Disliked
{quote} That's your call. In my newbie opinion, if you want to trade price action better take the pullback opportunities, however beware with big spikes counter pullbacks. Has SJ use to say "that's no man's land". But that's also the essence of price action traders. I guess you must judge well. No hesitations nor itchy fingers. Regards
Ignored
Maybe i didnt explain myself correctly, im not talking about so much as a pullback just as lets say were trending down and weve seen price retrace the current move down and are looking to place a short trade into the continuation of the trend, tdi crosses close outside pac etc all the signals are thereThen the next candle turns bullish at the start, this phsycs me out, i know that majority of the time it will end bearish but it makes me question my position.How do people deal with this
 
 
  • Post #54,557
  • Quote
  • Mar 5, 2015 9:55pm Mar 5, 2015 9:55pm
  •  H0rus
  • | Joined Feb 2015 | Status: Member | 32 Posts
Quoting haydo147
Disliked
{quote} Maybe i didnt explain myself correctly, im not talking about so much as a pullback just as lets say were trending down and weve seen price retrace the current move down and are looking to place a short trade into the continuation of the trend, tdi crosses close outside pac etc all the signals are thereThen the next candle turns bullish at the start, this phsycs me out, i know that majority of the time it will end bearish but it makes me question my position.How do people deal with this
Ignored
Self control and judgement trust. It's harder when monitoring, but if it's your confortable way to trade you must deal with it like everyone does.
Time and experience will teach you how to protect yourself from your mind.

May the green pips be with you!
 
 
  • Post #54,558
  • Quote
  • Mar 5, 2015 9:57pm Mar 5, 2015 9:57pm
  •  iCarumba
  • | Joined Mar 2010 | Status: Member | 84 Posts
Quoting emmanuel7788
Disliked
{quote} Hi Nods, It was set and forget trade. Placed on TP on the DOTS BT2 level and since I had my SL move to BE+, I went to bed. It hit my TP +72pips and recovered my previous day loss -50pips. {image} regards,
Ignored
Hi Emmanuel

I am wandering why would you take this trade. The daily TDI is strong bearish and even the 4hr TDI is going south?
I am asking if it's okay to trade counter trend since I have missed so many profitable trades with this system just because I didn't have courage to enter counter trend.
 
 
  • Post #54,559
  • Quote
  • Mar 5, 2015 9:57pm Mar 5, 2015 9:57pm
  •  haydo147
  • | Joined Sep 2014 | Status: Member | 167 Posts
<p>[quote=H0rus;8116174]{quote} Self control and judgement trust. It's harder when monitoring, but if it's your confortable way to trade you must deal with it like everyone does. Time and experience will teach you to how to shield from your mind. May the green pips be with you! <img src="http://assets.forexfactory.net/images/smilies/yim/winking.gif" border="0" alt="" title="Wink"
Thanks horus
 
 
  • Post #54,560
  • Quote
  • Mar 5, 2015 11:11pm Mar 5, 2015 11:11pm
  •  Erebus
  • Joined Jul 2011 | Status: Member | 7,290 Posts
Quoting haydo147
Disliked
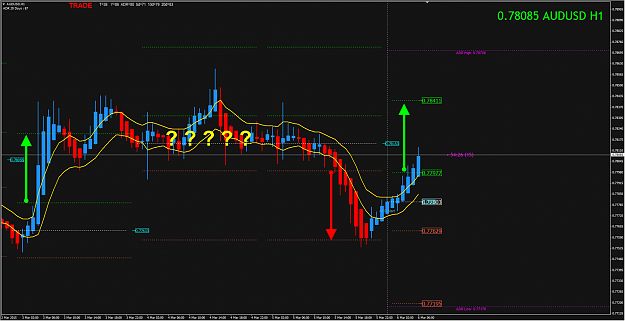
{quote} Maybe i didnt explain myself correctly, im not talking about so much as a pullback just as lets say were trending down and weve seen price retrace the current move down and are looking to place a short trade into the continuation of the trend, tdi crosses close outside pac etc all the signals are thereThen the next candle turns bullish at the start, this phsycs me out, i know that majority of the time it will end bearish but it makes me question my position.How do people deal with this
Ignored
There will be trades and days like that - see the ? ? ? ? day on the chart

As long as you use proper Position Size and Money Management, trust the method, not much else you can do

Attached Image (click to enlarge)
Click to Enlarge

Name: 6-03-2015 2-05-35 PM.png
Size: 267 KB
Don't believe everything that you THINK
BuyDips,SellRips Return This Week: na
 
 
  • Trading Systems
  • /
  • Trading Made Simple
  • Reply to Thread
    • 1 27262727Page 272827292730 7156
    • 1 Page 2728 7156
26 traders viewing now, 2 are members:
doddy
,
pareshshah
  • More
Top of Page
  • Facebook
  • Twitter
About FF
  • Mission
  • Products
  • User Guide
  • Media Kit
  • Blog
  • Contact
FF Products
  • Forums
  • Trades
  • Calendar
  • News
  • Market
  • Brokers
  • Trade Explorer
FF Website
  • Homepage
  • Search
  • Members
  • Report a Bug
Follow FF
  • Facebook
  • Twitter

FF Sister Sites:

  • Metals Mine
  • Energy EXCH
  • Crypto Craft

Forex Factory® is a brand of Fair Economy, Inc.

Terms of Service / ©2023