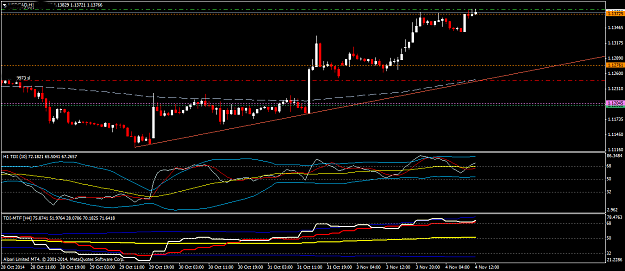
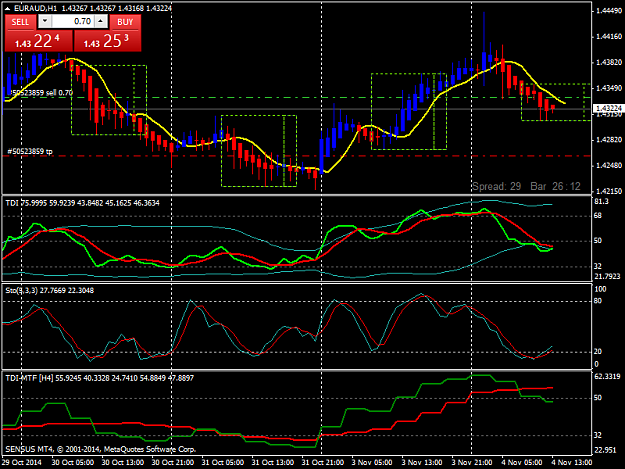
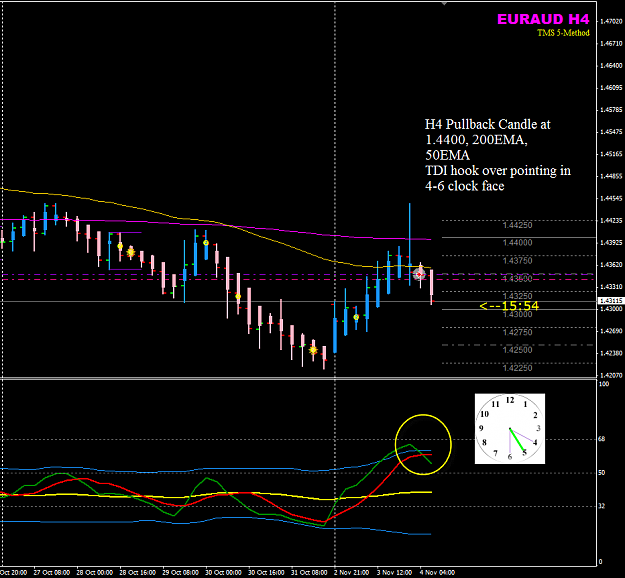
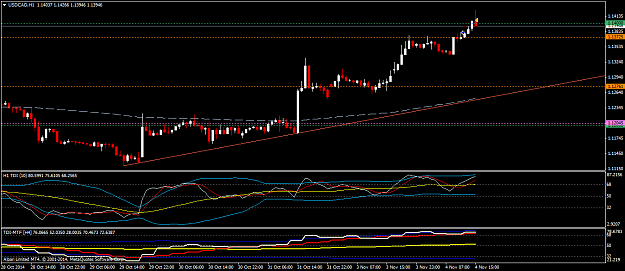
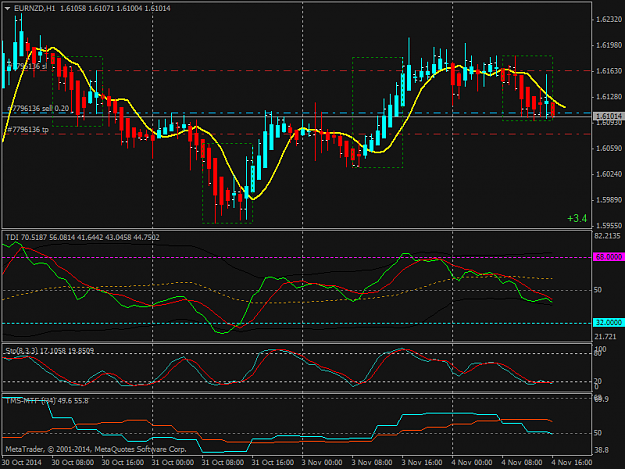
Disliked{quote} Here is what I usually do with Price Action reading the price bars on H1 charts. When I see the H1 TDI TSL Red line showing a nice slope, then it will also mean the H4 TDI Green is pointing at a steep angle 12-2 or 4-6 clock face angle. When the H1 TDI Red crosses the Yellow MBL, that is most situations is H4 TDI cross. Look back at history charts, draw a vertical line when you see a nice slope H1 TDI Red, then swicth to H4 and look at the H4 TDI Green, what do do the angle look like.Ignored
cheers!
Lorenzo