DislikedBritpip7 Thanks for the insight on slowing down the RSI and TSL. I have been trading on the H4 so will be trying that out. When you say to try: RSI for 4 hour at 4 is that the RSI_Period that come standard at 13 or the RSI_Price_Line which comes standard at 2? Also refering to the TSL: your suggestion is to try 9 on the 4 hour and is that the Trade_Signal_Line which comes standard at 7 or the Trade_Signal_Line2 which comes standard at 18. I'm new to this indicator and don't know how all the different inputs work, but you suggestion does make a lot...Ignored
TDL = Trade Signal Line in the TDI
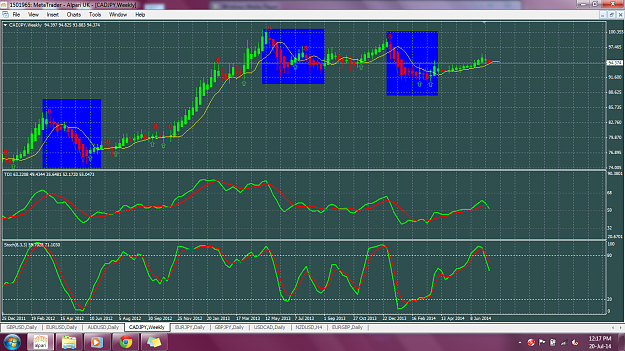
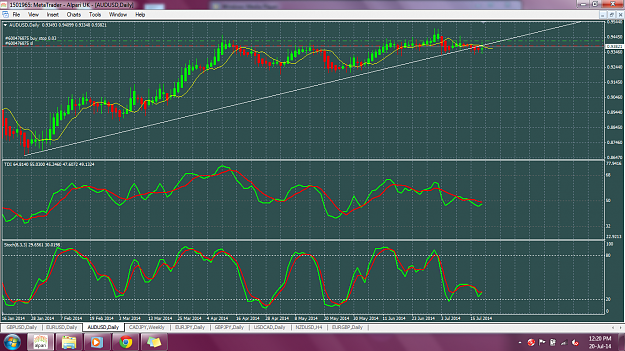
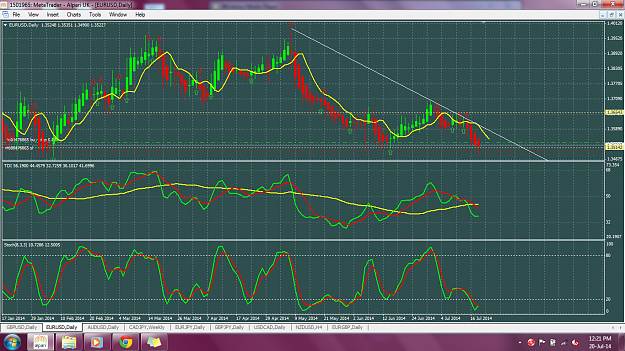
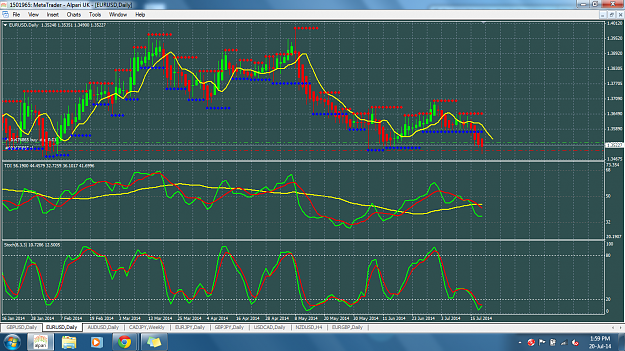
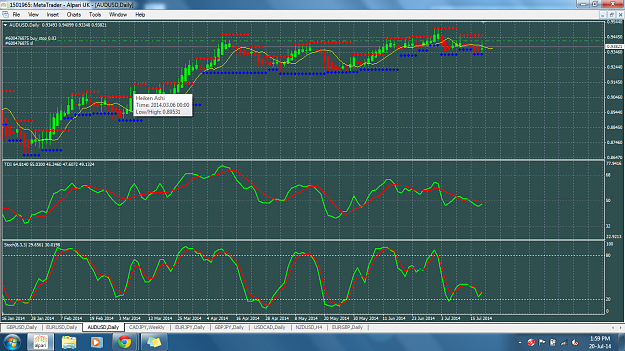
attached are my day chart settings
Attached Image
"To live with Passion, it takes Courage and Grace to survive"