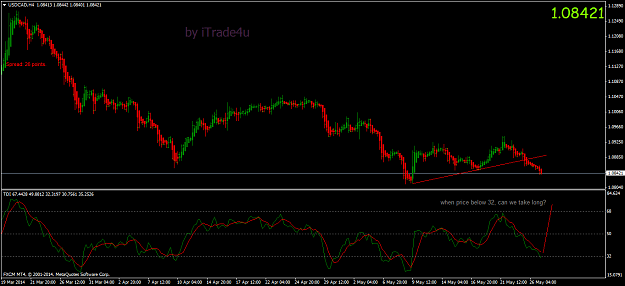
USDCAD H4 This is my question: Can I go long after breakdown 32 level of TDI? {image}
Ignored
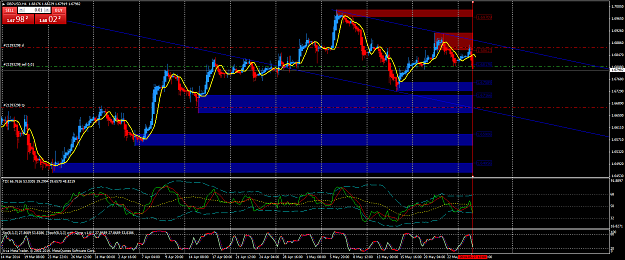
Previous H4 candle was a very strong engulf/outside bar. That together with TDI hooking down are telling me to go short.
To counter this I'll want to see strong candle, too, and not just TDI.
Attached Image
Everything you can imagine, is real - Pablo Picasso
{quote} Previous H4 candle was a very strong engulf/outside bar. That together with TDI hooking down are telling me to go short. To counter this I'll want to see strong candle, too, and not just TDI. {image}
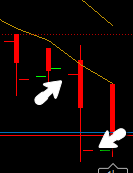
{quote} Depends on your template I guess. I can kind of see mine if I zoom in pretty close with those little horizontal line. Not as clear, but it's there. {image}
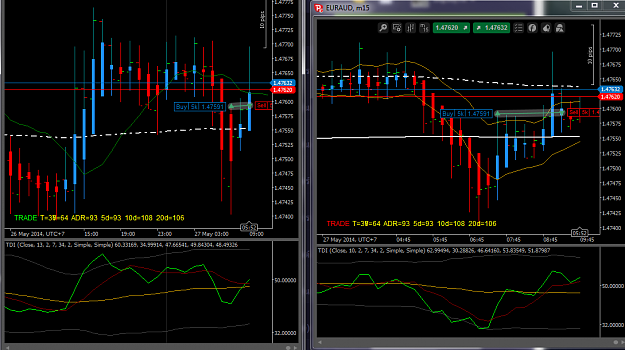
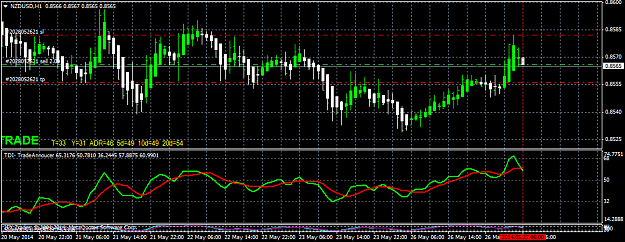
Hello everyone hope everyone is doing well. Went short on NZDUSD on H1 with green crossing red. Now +4 pips would anyone plz comment on this whether entry is according to TMS or I have missed something or I would have done a better entry than this.
Comments will be appreciated Thanks
Hello everyone hope everyone is doing well. Went short on NZDUSD on H1 with green crossing red. Now +4 pips would anyone plz comment on this whether entry is according to TMS or I have missed something or I would have done a better entry than this. Comments will be appreciated Thanks{image}
Ignored
Hi hiddengiant
I think this is a risky trade:
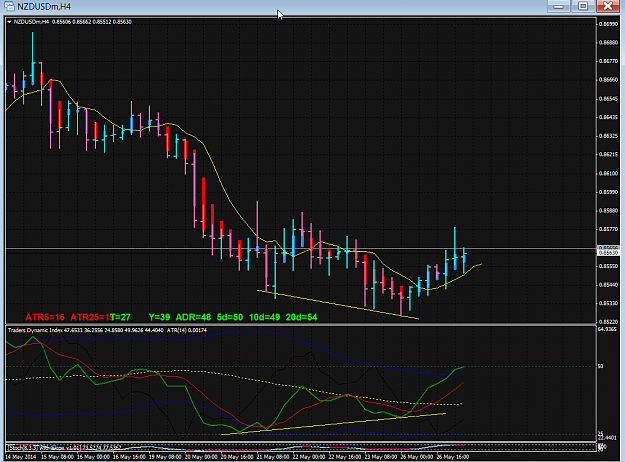
- Check HTF (higher time frame). Although H4 trend is down, there is a possible change in direction and trend (Green > Red > MBL)
- Daily TDi also just crossed up
- Divergence on H4 - possible change in trend
My two cents.
Axiom
Edit: But also consider H4 pinbar. So many things to consider ...
{quote} Hi hiddengiant I think this is a risky trade: - Check HTF (higher time frame). Although H4 trend is down, there is a possible change in direction and trend (Green > Red > MBL) - Daily TDi also just crossed up - Divergence on H4 - possible change in trend My two cents. Axiom Edit: But also consider H4 pinbar. So many things to consider ... {image}
Ignored
TMS H4 short entry at 12h00 GMT ?. But in resistance area 0.8500 - 0.8550.
{quote} Don't get what you mean if taking a short at resistence area is a bad idea?. Anyway, hiddengiant was aiming for about 10 pips and tp already hit
Ignored
Based on TDI only, looks like a short to me. On H4, a HH and HL had formed. The short would have to make a new LL in order to be in the money. So yes, I think conflicting signals probably reflected in my uncertain post. Its these kind of conflicts that always have me second guessing. Maybe i'm over-analysing? The disadvantage of being an accountant- always looking at the risk.
{quote} Based on TDI only, looks like a short to me. On H4, a HH and HL had formed. The short would have to make a new LL in order to be in the money. So yes, I think conflicting signals probably reflected in my uncertain post. Its these kind of conflicts that always have me second guessing. Maybe i'm over-analysing? The disadvantage of being an accountant- always looking at the risk.
Ignored
I don't see a HH and HL on H4. Perhaps ,you can post the chart so we can see what you are seeing
Yes you are right I just aimed for 10 pips but initially it went against me so closed for just +7 pips later saw it going 20 pips more. My impatience made me lose that 20 pips. But Iam more concerned ABout my entry with this system.
Made +14 pips with EJ and Lost 14pips on GU because of itchy fingers.
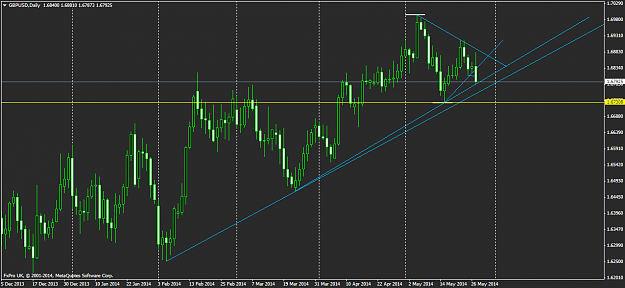
I can see a lower high on GBPUSD, coincidentally the 618 fibo retracement of the 09/05 bear move towards the bullish trendline... Will we see a break of trendline this week?
{quote} Hi yohan_ayala, There is no parameter setting for the HeikenAshi HA and the Average Price Bar APB. The difference between your D chart and mine posted is that I use a GMT0 sevrer tme broker and I see a Sunday candle. Your chart does not show a Sunday candle but the open price when NY opened on Sunday 25May is the same for both. Your Monday candle remain a red colour HA/APB. But today Tusday candle open and is now blue colour. What is more important is the TDI which is the heart of this trading method. Look at the TDI on your chart. regards,...
Ignored
Hallo Emmanuel,
I'm new in this thread and it takes me a few months to study and demo this system.
At this moment I'm thinking to trade the GBP/Jpy pair.
What is your opinion about a short trade with the 4 Hr time frame ??
Is it worthed to try ???
Thank you
veryspecial1
Hi Rajitomate
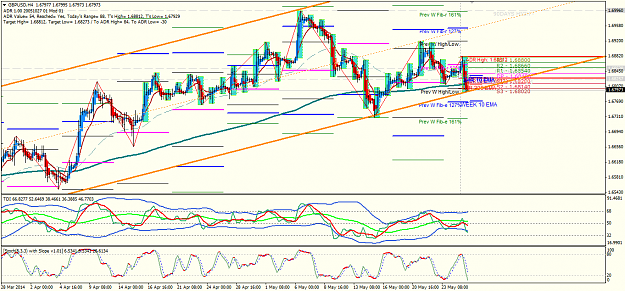
I have been using the sonic shi channel , which do you use , or do you make your own channel ?
I'm just trying to learn , so any help would be appreciated --as you see my channel would suggest a long trade soon
( I forgot to mention that mine is a daily channel on a H4 chart )
{quote} Hi Rajitomate I have been using the sonic shi channel , which do you use , or do you make your own channel ? I'm just trying to learn , so any help would be appreciated --as you see my channel would suggest a long trade soon {image}
Ignored
Hello Robuk:
I made my own channel. But what i really put all my attention is to the tdi green line crossing the red one. Also the stochastic 8,3,3. i also look the day chart and tdi shows a bounce trade.
I hope I could help you if dont, tell me and ill do my best
{quote} Hello Robuk: I made my own channel. But what i really put all my attention is to the tdi green line crossing the red one. Also the stochastic 8,3,3. i also look the day chart and tdi shows a bounce trade. I hope I could help you if dont, tell me and ill do my best