• Home
  • Forums
  • Trades
  • News
  • Calendar
  • Market
  • Brokers
  • Login
  • Join
  • User/Email: Password:
  • 11:48pm
Menu
  • Forums
  • Trades
  • News
  • Calendar
  • Market
  • Brokers
  • Login
  • Join
  • 11:48pm
Sister Sites
  • Metals Mine
  • Energy EXCH
  • Crypto Craft

Options

Bookmark Thread

First Page First Unread Last Page Last Post

Printable Version

Similar Threads

Auction Market Value Theory & Analytics 1556 replies

MarketProfile/Volume Profile/Auction Market Theory indi? 17 replies

Market Profile And Volume Profile MT5 0 replies

market Theory 101 Supply and Demand,Market Cycles 5 replies

Market profile trader-Merged profile 0 replies

  • Trading Discussion
  • /
  • Reply to Thread
  • Subscribe
  • 10,046
Attachments: Auction Market Theory and Market Profile
Exit Attachments

Auction Market Theory and Market Profile

  • Last Post
  •  
  • 1 199200Page 201202203 771
  • 1 Page 201 771
  •  
  • Post #4,001
  • Quote
  • Edited Feb 1, 2012 2:22am Jan 31, 2012 10:37pm | Edited Feb 1, 2012 2:22am
  •  Evak
  • Joined May 2011 | Status: Member | 691 Posts
Quoting tgwhbb
Disliked
once again you are right. given the support found at current week VAL, would you now expect to explore weekly VAH again?
Ignored
For simplicity sake i refer to the last 2 week merge as upper range & that lower distribution u see on my chart refer to as lower range.

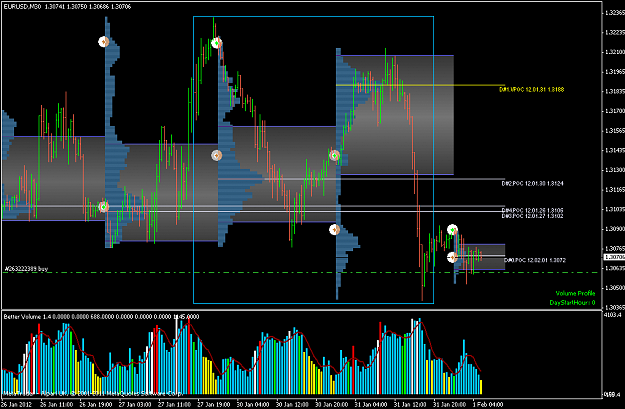
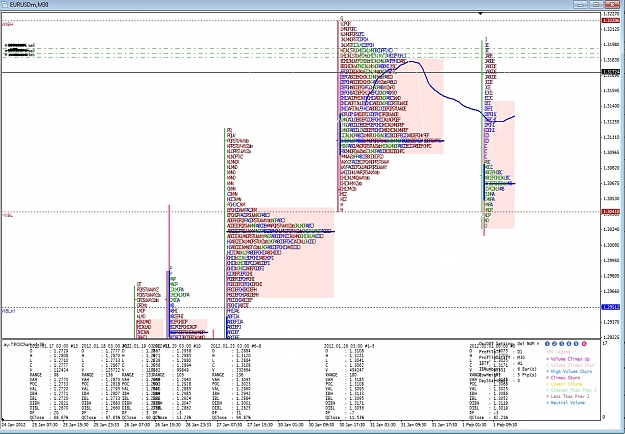
Given yesterdays move, furthur shorts to the down side would be in the books for now towards VAL as price would tend to make another swing low. Since ES is still within the upper range the immediate focus would then be the VAL, expect excess off the VAL too as this would be the normal expection for a reversion. Some lows would have to be clear for stops if price were to have another meaningful reversion , hence last week low point would also be of interest; where excess could be made to hunt stops.

On the flipside, furhur weakness below upper range VAL would be signal by a rejection off it, Price would then proceed to seek support off the lower distribution control.

Note that there are cases were the lower range VAH provide the support, for price to continue to explore furthur into the upper range.

SO; upper dsitribution VAL & the lower distribution VAH would be the immediate focus for any expectation for price to explore up...or down. Another words this area is the LVN..

I think roughly that's my thoughts for now.

EDIT: Just to add that if there is any meaningful rotation within the balance of the "upper range", then it would be natural for the value area to gradually shrink, therefore a good secondary reference would be the current developing week VA.
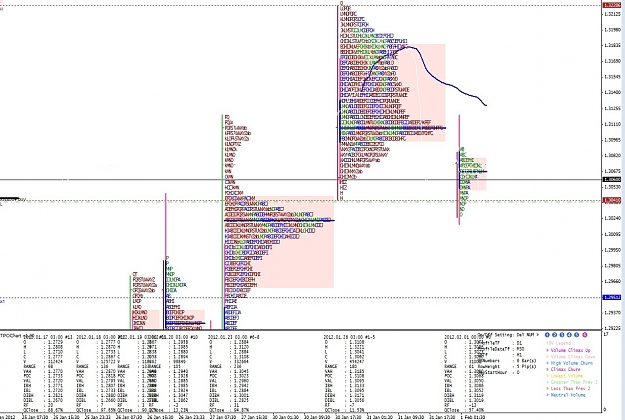
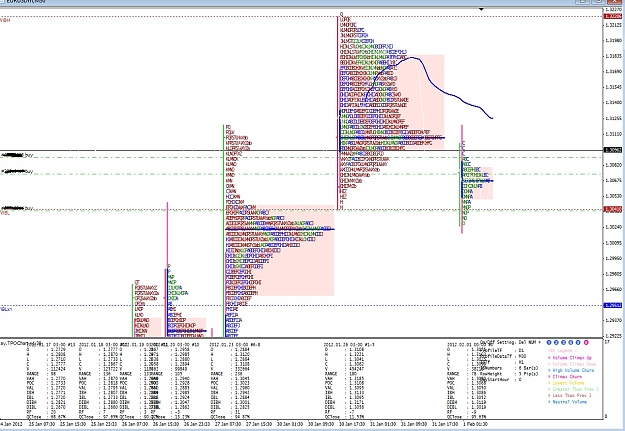
ES chart:
http://img403.imageshack.us/img403/7...6feb011112.gif

Uploaded with ImageShack.us
  • Post #4,002
  • Quote
  • Jan 31, 2012 11:11pm Jan 31, 2012 11:11pm
  •  Evak
  • Joined May 2011 | Status: Member | 691 Posts
Here is a 4 week merge of EU just to see the distribution & where price are now..

Quiet similar to the above explanation for ES in my reply above. (FYI TG)

BUT in EU case, it have drop below the current value & is now caught between the upper range VAL & the mid range VAH. So it is sitting in the LVN.

Since furthur weakness is expected here, the next level for support could be mid range's Mode. In some cases the Median level could be tested instead.

Another words if EU do not spring off from the LVN zone, the next valuation would be the mid range exploration.

http://img815.imageshack.us/img815/6...9feb011210.gif

Uploaded with ImageShack.us
  • Post #4,003
  • Quote
  • Edited Feb 1, 2012 12:12am Jan 31, 2012 11:56pm | Edited Feb 1, 2012 12:12am
  •  santoshdts
  • | Joined Dec 2011 | Status: Member | 86 Posts
Quoting Evak
Disliked
Eu back into the lower range (see chart) with now running into excess. Weeky profile here indicates rejection of that LVN as price sprung off it. So now strucuture should be expecting a pause & auctioning to balance (step 2 & 3 of steidmayer 4step process)..another words, massive LLB int a b formation.

Attachment 887920
Ignored
Hii..

Excellent explanation there, Attaching my chart below why does my chart looks different than Your's? In your chart I can see a second distribution below LVN, where as in my chart the profile is not extended till that level (1.30673). I am Using ay.MPDMW.v1.31.Rev.1 Indi, profileTF set to daily & Profile data TF to 30m,,
Am I missing out on some serttings.?

Please guide..

regards

Santosh

EDIT Attach:
Attached Image (click to enlarge)
Click to Enlarge

Name: eu.PNG
Size: 26 KB
If it was easy, everyone would do it.
  • Post #4,004
  • Quote
  • Feb 1, 2012 2:27am Feb 1, 2012 2:27am
  •  Evak
  • Joined May 2011 | Status: Member | 691 Posts
Quoting frankkn
Disliked
First post updated

If the major contributors send me a link it will be on the OP asap
Ignored
Tks frank, that was fast...

FYI all, I have requested frankkn to update his 1st post of some of the reference collection that was share here, so it would be easier now to point to the 1st post if any one ask...

tks
  • Post #4,005
  • Quote
  • Feb 1, 2012 2:29am Feb 1, 2012 2:29am
  •  Evak
  • Joined May 2011 | Status: Member | 691 Posts
Quoting santoshdts
Disliked
Hii..

Excellent explanation there, Attaching my chart below why does my chart looks different than Your's? In your chart I can see a second distribution below LVN, where as in my chart the profile is not extended till that level (1.30673). I am Using ay.MPDMW.v1.31.Rev.1 Indi, profileTF set to daily & Profile data TF to 30m,,
Am I missing out on some serttings.?

Please guide..

regards

Santosh

EDIT Attach:
Ignored
this is a different indi which is usefull for watching clusters of POC but it cannot do profile merge. Your chart is a daily profile where else mind is a weekly profile. U can set that indi on your chart to show weekly too if u wish but this indi dont do merge.
  • Post #4,006
  • Quote
  • Feb 1, 2012 2:42am Feb 1, 2012 2:42am
  •  santoshdts
  • | Joined Dec 2011 | Status: Member | 86 Posts
ThanX for your Kind reply.. I got it..

Thanks again..
If it was easy, everyone would do it.
  • Post #4,007
  • Quote
  • Edited at 3:34am Feb 1, 2012 2:49am | Edited at 3:34am
  •  mzvega
  • Joined May 2009 | Status: Member | 1,879 Posts
Im inclined to get long from a merged profile view, as we have tested the value area high of a previous 3 day balance, its also rejecting the now current wibl, lets see if we will return to the previous value area, or atleast revisit the val of the previous balance area

Edit: I decided to take a long at the weekly initial balance low (WIBL), ill see how this works out. I may add to my position if price holds above the daily open
Attached Image (click to enlarge)
Click to Enlarge

Name: merged.jpg
Size: 263 KB
Markets are not efficient, rather they are effective - Jones
  • Post #4,008
  • Quote
  • Feb 1, 2012 4:08am Feb 1, 2012 4:08am
  •  Evak
  • Joined May 2011 | Status: Member | 691 Posts
Quoting Evak
Disliked
Here is a 4 week merge of EU just to see the distribution & where price are now..

Quiet similar to the above explanation for ES in my reply above. (FYI TG)

BUT in EU case, it have drop below the current value & is now caught between the upper range VAL & the mid range VAH. So it is sitting in the LVN.

Since furthur weakness is expected here, the next level for support could be mid range's Mode. In some cases the Median level could be tested instead.

Another words if EU do not spring off from the LVN zone, the next valuation would be the mid...
Ignored

Bounce off the Mid range MODE & now back into the upper range..in most cases this would be a trip back to the upper range VAH. So another round of valuation again of this upper range..
http://img217.imageshack.us/img217/9...1feb011705.gif

Uploaded with ImageShack.us
  • Post #4,009
  • Quote
  • Feb 1, 2012 4:09am Feb 1, 2012 4:09am
  •  mzvega
  • Joined May 2009 | Status: Member | 1,879 Posts
ive added to my original position, Im hoping this may go through to the top of value.
Attached Image (click to enlarge)
Click to Enlarge

Name: merg.jpg
Size: 307 KB
Markets are not efficient, rather they are effective - Jones
  • Post #4,010
  • Quote
  • Feb 1, 2012 4:21am Feb 1, 2012 4:21am
  •  Evak
  • Joined May 2011 | Status: Member | 691 Posts
Enter long as as price response off the MODE (see my previous post), Just prior to UK open, Price then revert back into US low. UK open with an opening drive initiatives. Entry was made just prior to UK open with intial risk of 18p. Exposure reduce at 3100 with a 50 pips. Note the LLB i mention in my previous post. In most cases the reversion would be back into where the LLB started..

http://img718.imageshack.us/img718/3...2feb011717.gif

Uploaded with ImageShack.us
  • Post #4,011
  • Quote
  • Feb 1, 2012 8:14am Feb 1, 2012 8:14am
  •  Evak
  • Joined May 2011 | Status: Member | 691 Posts
Quoting Evak
Disliked
Bounce off the Mid range MODE & now back into the upper range..in most cases this would be a trip back to the upper range VAH. So another round of valuation again of this upper range..
Ignored
Price hit the top of the upper range now, in addition we have a ascending flag formation. Next in the order would be a pause & pull back to balance - Median line as a guide


http://img341.imageshack.us/img341/4...3feb012106.gif


As noteed ealier, that price tendencis have reverted to where the LLB was started..
http://img17.imageshack.us/img17/343...4feb012118.gif

Uploaded with ImageShack.us
  • Post #4,012
  • Quote
  • Feb 1, 2012 8:33am Feb 1, 2012 8:33am
  •  ivonivon
  • | Joined Aug 2006 | Status: Member | 204 Posts
Counter-trend moves very often find support at previous HVN.
Coincide with Naked POC.
Attached Image (click to enlarge)
Click to Enlarge

Name: 01Feb2012.gif
Size: 40 KB
  • Post #4,013
  • Quote
  • Feb 1, 2012 9:01am Feb 1, 2012 9:01am
  •  ivonivon
  • | Joined Aug 2006 | Status: Member | 204 Posts
EUR A0-FX now are at the extremes of:
- 5 Day ADR
- Previous day's high
- Composite profile

Please be cautious bull
  • Post #4,014
  • Quote
  • Feb 1, 2012 10:30am Feb 1, 2012 10:30am
  •  mzvega
  • Joined May 2009 | Status: Member | 1,879 Posts
Decicde to reverse my position. Im not sure how well this will turn out, but Ill hld the trade for awhile.
Attached Image (click to enlarge)
Click to Enlarge

Name: merged.jpg
Size: 335 KB
Markets are not efficient, rather they are effective - Jones
  • Post #4,015
  • Quote
  • Feb 1, 2012 11:16am Feb 1, 2012 11:16am
  •  Evak
  • Joined May 2011 | Status: Member | 691 Posts
Add to my previous long as price trade back up above yesterday US high, back into the previous range as indicated in the chart, which was my day timeframe reference range.

NY opens onto UK pullback low which also a previous NY high which is my immediate reference. Then in b period we have a response into the said level with increase volume. I made my entry after a slight bounce off b period low.

Intitial risk is 15p. Exposure for this trade was reduced for 36p.....

yesterday high would be a contention...

http://img28.imageshack.us/img28/934...5feb020003.gif

Uploaded with ImageShack.us
  • Post #4,016
  • Quote
  • Edited at 12:02pm Feb 1, 2012 11:49am | Edited at 12:02pm
  •  santoshdts
  • | Joined Dec 2011 | Status: Member | 86 Posts
A Long Term Prospective, Refering Monthly profile of EU. We can see PA has crossed Dec POC.. and is this heading to fill tha Low Usage area and may test Dec. VAH.
Attached Image (click to enlarge)
Click to Enlarge

Name: eu.PNG
Size: 20 KB
If it was easy, everyone would do it.
  • Post #4,017
  • Quote
  • Feb 1, 2012 11:54am Feb 1, 2012 11:54am
  •  s7c
  • | Joined Mar 2011 | Status: try and fail but don't fail to try | 289 Posts
Quoting Evak
Disliked
Add to my previous long as price trade back up above yesterday US high, back into the previous range as indicated in the chart, which was my day timeframe reference range.

NY opens onto UK pullback low which also a previous NY high which is my immediate reference. Then in b period we have a response into the said level with increase volume. I made my entry after a slight bounce off b period low.

Intitial risk is 15p. Exposure for this trade was reduced for 36p.....

yesterday high would be a contention...
Ignored
the relation between me and market reflect the Murphy's laws monday i closed my long before tokyo and tokyo rallied, yesterday i didn't and of course tokyo went lower. somehow markets feels alive
i didn't took the long from london, somehow it wasn't so clear for me.
i took this in pit session based on kind the same considerations as yours, but i entered in a period, in b period i see an open auction in range and almost i exited. fortunately i didn't and i'm out just now, based on the lack of confidence and probability of tight range.
by the way does somebody have experience with windotrader?
http://www.windotrader.com/Home.aspx
  • Post #4,018
  • Quote
  • Feb 1, 2012 12:11pm Feb 1, 2012 12:11pm
  •  mzvega
  • Joined May 2009 | Status: Member | 1,879 Posts
Quoting santoshdts
Disliked
Refering Monthly profile of EU. We can see PA has crossed Dec POC.. and is this heading to fill tha Low Usage area and may test Dec. VAH.
Ignored
Just alittle food for thought..........
from a monthly profile perspective, how did last month compare to the previous month? Value migrated lower, which is seen as bearish. The poc also migrated lower, also considered bearish, and all on increased volume, and we cant say we have technically stopped "one timeframing" down. From an AMT perspective imo sugguests bearishness.
Take my thoughts with a grain of salt, Im often not correct in my analysis.
but from a "text book" point of view, I see bearishness
Markets are not efficient, rather they are effective - Jones
  • Post #4,019
  • Quote
  • Edited at 1:25pm Feb 1, 2012 12:27pm | Edited at 1:25pm
  •  Aztrader2
  • | Joined Oct 2010 | Status: Freedom Trader | 444 Posts
Quoting Evak
Disliked
Here is a 4 week merge of EU just to see the distribution & where price are now..

Quiet similar to the above explanation for ES in my reply above. (FYI TG)

BUT in EU case, it have drop below the current value & is now caught between the upper range VAL & the mid range VAH. So it is sitting in the LVN.

Since furthur weakness is expected here, the next level for support could be mid range's Mode. In some cases the Median level could be tested instead.

Another words if EU do not spring off from the LVN zone, the next valuation would be...
Ignored
The Great thing about it, is that it made a bounce @ the pip...from last week POC! And then shooted 200 pips up! Are you a magician, who can predict the future? No, I don't think so: you're a guy who knows very well how to use a formidable tool like Market Profile....

Less thahn 20 pips Risk for a possible >200 pips reward...... Oh my God, that's trading......

I'm a totally newbie here, but I've learned more reading some of your posts and starting to read Dalton's book Mind over Markets than in almost 2 years spent wandering in the dark (i.e. into the majority of FF threads...)
Supply & Demand.... that's what moves the market...nothing less, nothing more.... and the best identifier of these forces is MP. Isn't it?

I've just a question regarding today: EU made his way bouncing from a critical level.... But, generally speaking, USD & JPY dropped against EUR/GBP/AUD.... All these moves started at the same time..... So, was it just a coincidence that EURUSD was rejected at that precise point?
In EUR/USD we could better identify & would have predicted it would happen @ that level.
But (e.g. for AUD USD weekly profile in my chart) it seems to me it was not so simple to expect such a move just looking @ the MP. Unless to consider the center of upper VA of 13 weeks ago in that bimodal distribution(red line in the chart) .... Or, is there something I'm still not able to see..?

btw: what version of the indi is in your chart with merged weekly profile?

Thanks!
Attached Image (click to enlarge)
Click to Enlarge

Name: aud.jpg
Size: 129 KB
  • Post #4,020
  • Quote
  • Feb 1, 2012 12:44pm Feb 1, 2012 12:44pm
  •  Aztrader2
  • | Joined Oct 2010 | Status: Freedom Trader | 444 Posts
Quoting s7c
Disliked
the relation between me and market reflect the Murphy's laws monday i closed my long before tokyo and tokyo rallied, yesterday i didn't and of course tokyo went lower. somehow markets feels alive
Ignored

Don't worry bro...you're not alone......
Yesterday I spent the morning fightin' against the market (EURUSD) to grab some pips... It went up and down until noon, never allowing a nice run.... Then, in the afternoon I fell asleep, coz i was exausted.... and it made the big down move.
Today I read Evak's post about EUR/USD and saw the initial few pips bounce... I was tempted to go long, but had to go away from home and didn't do it..... and went out.
Not necessary to say it went straight up whitout any hesitation!!!!

Murphy's laws rulez here......
  • Trading Discussion
  • /
  • Auction Market Theory and Market Profile
  • Reply to Thread
    • 1 199200Page 201202203 771
    • 1 Page 201 771
0 traders viewing now
  • More
Top of Page
  • Facebook
  • Twitter
About FF
  • Mission
  • Products
  • User Guide
  • Media Kit
  • Blog
  • Contact
FF Products
  • Forums
  • Trades
  • Calendar
  • News
  • Market
  • Brokers
  • Trade Explorer
FF Website
  • Homepage
  • Search
  • Members
  • Report a Bug
Follow FF
  • Facebook
  • Twitter

FF Sister Sites:

  • Metals Mine
  • Energy EXCH
  • Crypto Craft

Forex Factory® is a brand of Fair Economy, Inc.

Terms of Service / ©2021