Joined Sep 2010
|
Status: Please Don't Judas Me
|432 Posts
Steve, very impressive indeed! Areas of Supply & Demand stick out like a sore thumb on your template. I must say however I haven't yet been able to replicate this myself (though I haven't given up yet). For example the historical open is 1.0446, which I don't see ploted anywhere. The for historical High & Low do we should be using the absolute H & L ever? I don't think it is the H & L of that first month's candle? Already challenegd by the first steps I am already scratching my head. Anyway, perhaps step by step instructions how you construct this illustrated with screen shots would be golden.
Thanks for sharing your insight!
t
"As Kids we believe Anything is Possible; the Trick is to never forget it!"
Steve, very impressive indeed! Areas of Supply & Demand stick out like a sore thumb on your template. I must say however I haven't yet been able to replicate this myself (though I haven't given up yet). For example the historical open is 1.0446, which I don't see ploted anywhere. The for historical High & Low do we should be using the absolute H & L ever? I don't think it is the H & L of that first month's candle? Already challenegd by the first steps I am already scratching my head. Anyway, perhaps step by step instructions how you construct this...
Ignored
Hi teemo,
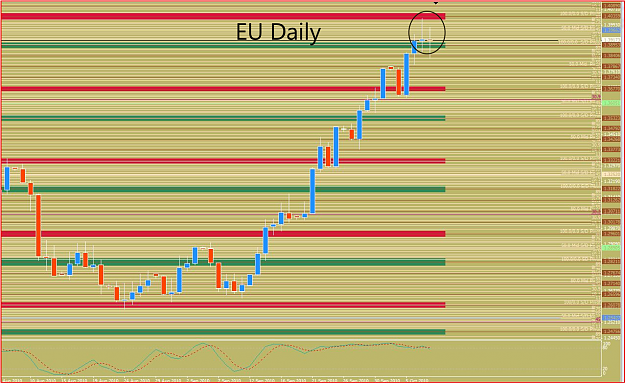
I'm not sure about the way the open was plotted on the first template I posted, there should be a red line there. I made some small corrections over the past few days even though the original I posted was pretty straight. Anyway, this one definitely shows the open price in the right place. Red lines show open high and low.
I also had the ultimate fibs upside down which I corrected on this template. These are also updated with the rectangles through to the 10th.
---------------------------------------------
Ok, Instructions for making the happs charts
--------------------------------------------
Yes, historical high-highest high ever made in the pair, and lowest low ever made, along with the open.
There's been some confusion about open price due to data differences between brokers. The value I used is: 1.0446.
Those are your first three lines.
1)So just plot those lines.
2)Then put lines half way between those three.
That gives you two more lines-those are your 1st rank 50% lines.
Make them a different color than the ones you used for the H,L,O.
3)Now put a line half way between each line on the chart. You will get 4 new lines. Those are your 2nd rank 50% lines. Make them a different color than HLO, or 1st rank lines.
All second rank lines should be the same color as each other, but different than HLO, or 1st rank
4)Now put another set of lines halfway between each line on the chart. These are your 3rd rank 50% lines. Make them a different color as the others, but the same color as each other.
5)Do this once more to get 4rth rank 50% lines,
6)and once more again to get 5th rank 50% lines.
So, get your H-lines plotted right, HLO, and 1-5th rank 50% lines.
Then I usually insert a text blurb so I can remember which color stands for what rank.
-----------------------------------------
Now you have to make the SD Pivot Zones, these are the colored rectangles.
Only the H,L,O, and 1st through 4rth rank lines get these rectangles placed around them.
5th rank 50% lines do not.
To determine the correct distance which the rectangles should be placed away from the 1st through 4rth rank lines-you must first determine the base phase height.
To do this, just place your fibs from any 1st through 4rth rank line to the next nearest 1st through 4rth rank line, 100% to 0%. Thats the base phase height.
Now starting at the 17% and extending to the 23.6% away from any 1st through 4rth rank 50% line is where the colored rectangle goes. Place a rectangle in that area-then change the dates so it extends from way back when to the present.
Now your rectangle should be placed 17% to 23% base phase hieght away from your 1st through 4rth rank 50% line.
On the lower side of your 1st through 4rth rank line, you need to do the same thing. Put a rectangle 17% to 23% base phase hieght below your 1st through 4rth rank 50% line. Then adjust the date.
When placing a rectangle below a 1st through 4rth rank line, the easiest thing to do is-when you determine the base phase hieght, instead of putting the 100% on the higher line, put the 100% on the lower line, and the 0% on the higher line. This will show the ratios upside down, to make it easier for you to place the rectangle below.
Now that you have your rectangles placed around your 1st through 4rth rank line, all you have to do is set your fibs inside of it.
The 100/0% S/D Pivot Label goes right in the center of one rectangle, and another 100/0% S/D pivot Label goes in the center of the lower rectangle. The 50% fib line should hit your 1st through 4rth rank 50% line.
Label the 50% fib line, "50% Mid S/D Pivot"
Now you've done a level.
Repeat this process at the next higher or lower 1st through 4rth rank 50% line.
In the large space between the lower rectangle of one level, and the higher rectangle of another, is where you place your larger phase fibs. Just start them right at the center of the lower rectangle from the higher level, and end them right at the center of the higher rectangle from the lower level. Change the 50% fib label to "Mid Pivot", extend the dates, etc.
Now you have done a complete phase.
Thats basically it. Just repeat the process until its all filled in.
------------------------------------
attached below is the template with the small corrections.
As of now it does not draw the fibs between phases nor shows Historical high ,low, and open but will include that in the next version if required.
The input is obvious.
Cheers
Pat
Ignored
Wow, thanks Pat, it looks great.
I only see two problems.
It erases the fibs if you place them manually when you switch time frames.
And its not placing the levels from the open to the low. I know thats a little more complicated, because you have a different schemes spatially from the open to the low, than from the open to the high.
Maybe the easiest thing to do is just make a separate indicator for the levels from the open to the low.
Anyway, I very much appreciate your work. If you want to update it so it automatically fills in the fibs that would be great. That would take care of the problem of its erasing manually placed fibs.
However you want to go about it, or not at all... What you've done already is very much appreciated.
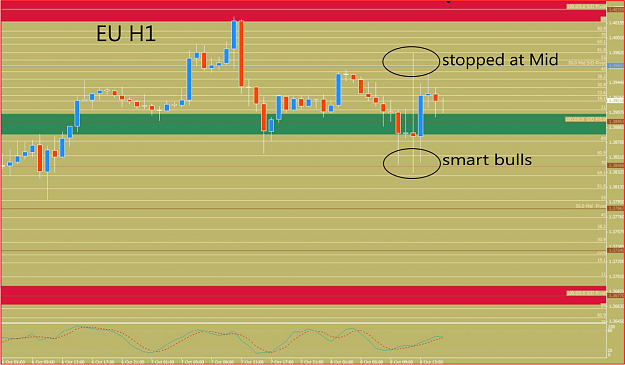
Here's a screenshot from the GU using the indy. Can't get a pic of recent price on this yet because GU is ranging between Open and Low right now, and the indy doesn't yet make those levels. But here's some past data, looks nice.
Joined Sep 2010
|
Status: Please Don't Judas Me
|432 Posts
Thank You Kindly Steve - Great Explanation & Support!
Looking at that chart you can truly see the levels where all these big block orders have been executed. Various time frame candle patterns clearly show how price literally races away from those areas due to supply/demand imbalances (too much demand in relation to available supply & vice versa). I really liked the levels created when Historial High & Low were divided into 50% segments all the way to tradeable phases (+/- 120 pips on EURUSD), disregarding Historical Open.
Definitely a chart set-up I will be looking at in the long term for my trading.
Cheers!
I'm not sure about the way the open was plotted on the first template I posted, there should be a red line there. I made some small corrections over the past few days even though the original I posted was pretty straight. Anyway, this one definitely shows the open price in the right place. Red lines show open high and low.
I also had the ultimate fibs upside down which I corrected on this template. These are also updated with the rectangles through to the 10th.
---------------------------------------------
Ok, Instructions for making...
Ignored
"As Kids we believe Anything is Possible; the Trick is to never forget it!"
As of now it does not draw the fibs between phases nor shows Historical high ,low, and open but will include that in the next version if required.
The input is obvious.
Cheers
Pat
Ignored
Pat, thanks for creating this indi.
Steve, how are you determining the "Open" price. I see in Pat's indi that a value of 1.04608 is used as the Open. Is there a certain date attached to this?
Regards,
Marc
When this baby hits 88 miles per hour, you're gonna see some serious s***.
Steve, how are you determining the "Open" price. I see in Pat's indi that a value of 1.04608 is used as the Open. Is there a certain date attached to this?
Regards,
Marc
Ignored
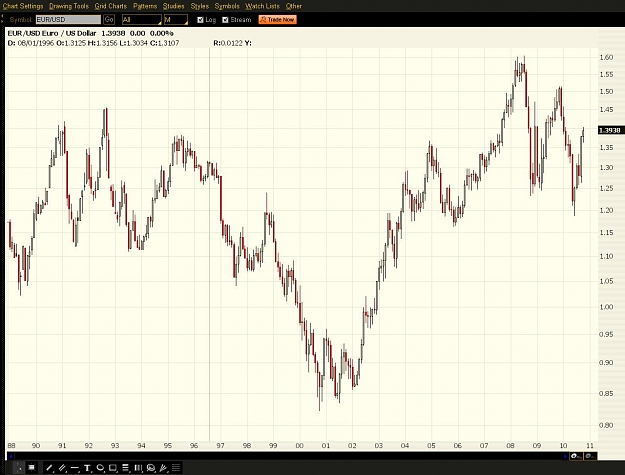
Hi Marc, I'm using the data I have from IBFX. The earliest candle on the Monthly for the EU comes from the 4rth month of 1989. Gives the opening value as 1.0446. Its hitting all the highs and lows very nicely, but if someone has an earlier or somehow better value, they can certainly post it.
Hi Marc, I'm using the data I have from IBFX. The earliest candle on the Monthly for the EU comes from the 4rth month of 1989. Gives the opening value as 1.0446. Its hitting all the highs and lows very nicely, but if someone has an earlier or somehow better value, they can certainly post it.
Thanks, Steve
Ignored
Ok. I understand now. I do have data back to 1/1/1989. Open for the month was 1.173
Attached Image (click to enlarge)
When this baby hits 88 miles per hour, you're gonna see some serious s***.
It erases the fibs if you place them manually when you switch time frames.
And its not placing the levels from the open to the low. I know thats a little more complicated, because you have a different schemes spatially from the open to the low, than from the open to the high.
Steve,
Based on your previous post regarding au where the diff between the open and low was twice that of between high and open, you suggested using 5th rank instead of 4 for below open vs above open so that the phase range of the above and below are close.
Using the indi below("v2), enter the value of "0" for H_Open and the phases will be plot from high to low. The reason for this suggestion is that the currently the selection of H_Open is arbitrary, due to, I am assuming here( and everyone knows what "ass_u_me" means) , of the limitations of data availability. If for instance if we had data from DEC 1997 for a particular symbol we would have had to use that as H_Open and not June 1989 as we do for EU. However, the H_High and H_Low are defined by the market.
Another solution maybe to establish a minimum value of the phase range, say 100 pips( this makes it arbitrary again), and the factoring of the space between High - Open and Open - Low should be done such that Max factoring would be upto the fourth rank while the minimum would be "0' such that the minimum factoring phase range is always greater than the user defined value, 100 pips in this example. This has not been programmed into version 2.
The following indi will draw some fibs, 23, 38, 62 and 77 based on the period of the chart. for example, if the chart is daily or above it will not draw the fibs. If the chart is H4 chart, only the 38 and 62 fibs are drawn. Anything below H4, all of the above mentioned fibs will be drawn. The Fibs around the 50% of the Large phase are all magenta while the other ones are white. 38 and 62 are dashed style while 23 and 77 are dotted lines. All colors however, are user selectable. In other words, all you have to do is Attach the indi to any chart with approriate input data and you can switch the periods of the chart and the indi will draw fibs based on the period of the chart. IMHO, it reduces clutter. Just try it on EU, and randomly change the period of the chart to know what I mean.
The indi does draw H,O,L but they are is not quite visible at the moment. You can see them in the Object List of the chart. I will address that issue in the next version. Have not come up with a way to indicate the rank of the phase lines either, such as what you have suggested with different colored lines, but that will implementedi in future versions.
Another suggestion that comes to mind is making the colors of the congestion/buysell rectangles same instead of red and green as red typically indicates sell, short, stop, reverse etc and reverse of the green. Any darker or lighter shade of the background should work well.
If the Historic High, Low, and Open values of all currency pairs can be tabulated, than it can be programmed into the indi which would eliminate inputting of those values. I am not sure if different broker feeds would have variation in values?
Either that or just post a table of values in the first post so everyone is in the same page so to speak.
Joined Oct 2007
|
Status: Summer is the best time of year!
|1,284 Posts
I knew it wouldn't be long before tools for this approach would be developed. Kudos to Pat. I would suggest that Steve either indicate what the values are for each pair and program them into the indicator or save some templates for each pair and add to post one...just do something so there are not 12 different variations for the same pair.
Cheers
CanuckCT
Ignored
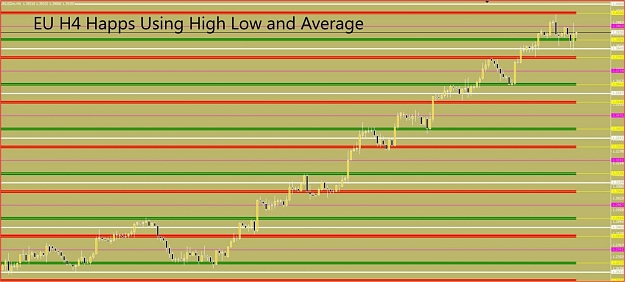
I hear you Canuck. Possibly the best solution is to switch to something more objective than using the Hist Open. Check out this picture of the EU, where for the middle value I simply used the average between the high and the low. It does just as good, if not a better job than using the open. And with this there can be no discrepancies-everyone has the same high and low values.