DislikedAlso read the attached pdf, lascavel posted the link to this stuff.
Here its also explained what is SM doing during accumulation, markup, distribution and mark down phase,but read it with reserve, because there are some curious things: such as during accumulation on the schematics 2 the text explains that how disribution is working, so the text is not properly connected to picture. But its very good article.
Enjoy!Ignored
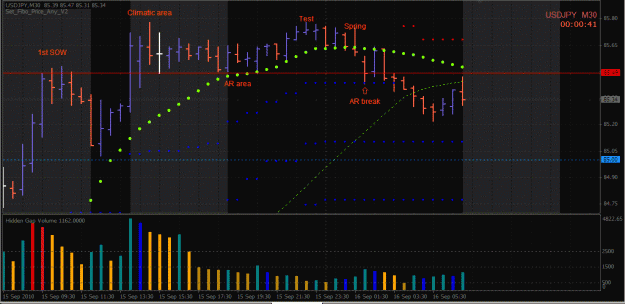
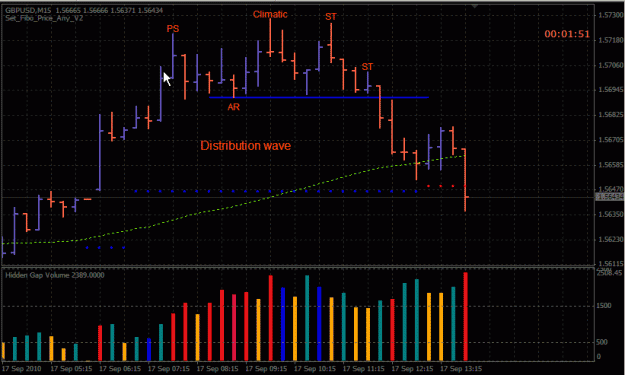
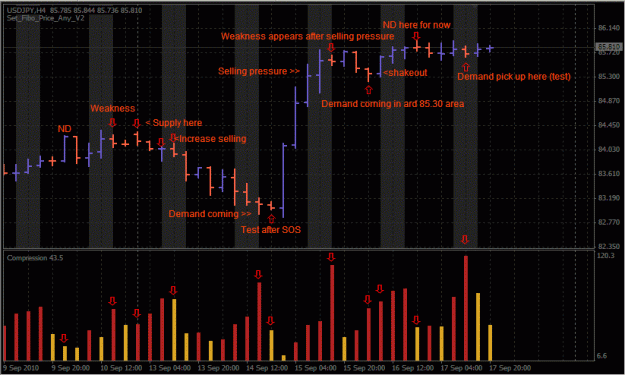
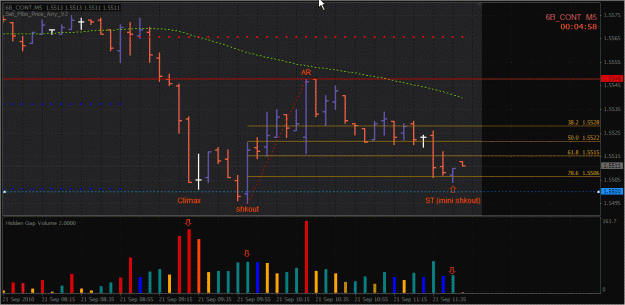
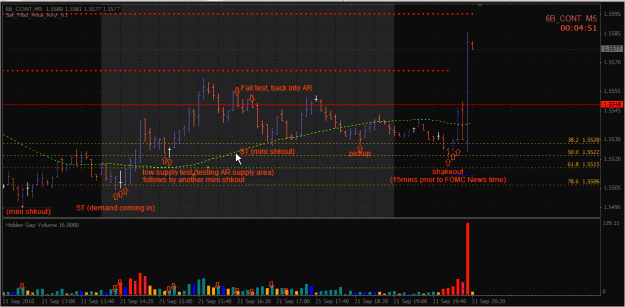
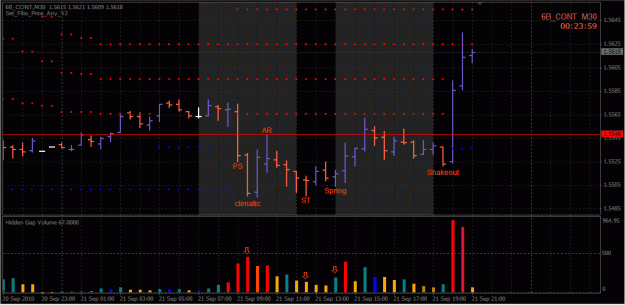
Just to illustrate the Wyckoff Scematics framework which have implication on your VSA analysis. Chart of UJ. UJ could be building up for a re accumulation phase after a major shakeout yesterday due to BOJ intervention. Therefore a correction to around either 85.10 or down to 84.77 should be expected in which a climatic activity will mostly likely occur.
Cheers!
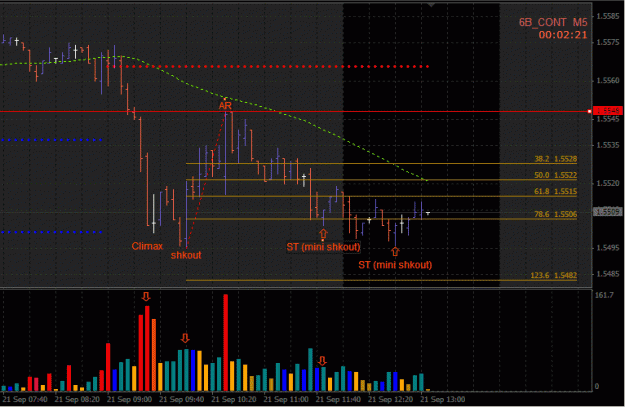
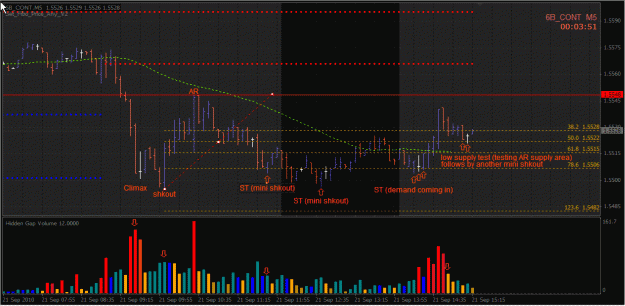
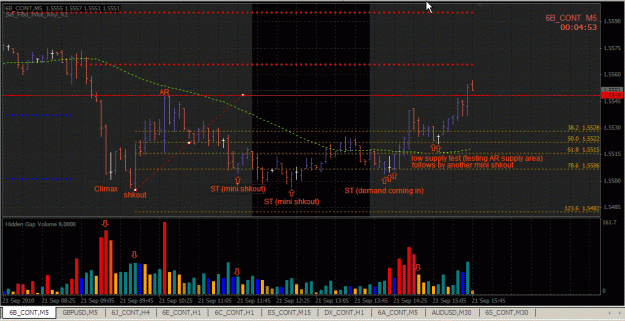
Attached Image (click to enlarge)