• Home
  • Forums
  • Trades
  • News
  • Calendar
  • Market
  • Brokers
  • Login
  • Join
  • User/Email: Password:
  • 11:09am
Menu
  • Forums
  • Trades
  • News
  • Calendar
  • Market
  • Brokers
  • Login
  • Join
  • 11:09am
Sister Sites
  • Metals Mine
  • Energy EXCH
  • Crypto Craft

Options

Bookmark Thread

First Page First Unread Last Page Last Post

Print Thread

Similar Threads

VSA-divergence trading 187 replies

How to Blow $200 account using VSA--- 594 replies

VSA Journal 57 replies

E/J VSA +30 a day 3 replies

VSA broker history change datas 11 replies

  • Trading Discussion
  • /
  • Reply to Thread
  • Subscribe
  • 25
Attachments: VSA learching
Exit Attachments
Tags: VSA learching
Cancel

VSA learching

  • Last Post
  •  
  • 1 Page 234 5
  • 1 Page 234 5
  •  
  • Post #21
  • Quote
  • Sep 7, 2010 8:22am Sep 7, 2010 8:22am
  •  Gesek
  • | Joined May 2010 | Status: Member | 45 Posts
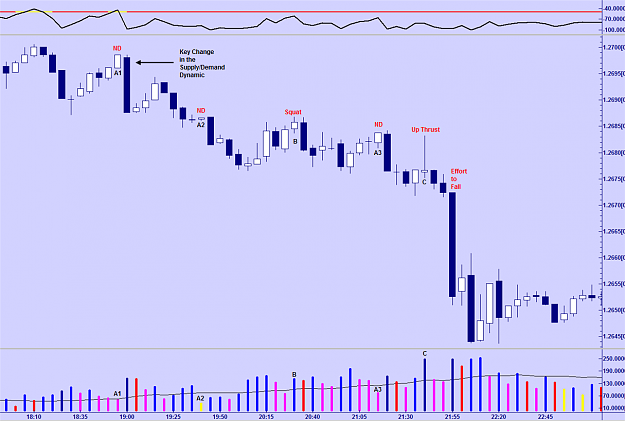
I would like to attach the pdf which is the same as the web page. So you can learn from this. Read it until you understand the basic concept of the volume. Especially the colors of the volume bars, which is really the absolute basic!
Attached File(s)
File Type: pdf Better_Volume_Indicator.pdf   322 KB | 1,119 downloads
 
 
  • Post #22
  • Quote
  • Sep 7, 2010 3:34pm Sep 7, 2010 3:34pm
  •  Gesek
  • | Joined May 2010 | Status: Member | 45 Posts
Here we have another example:
http://i1008.photobucket.com/albums/...olation1-1.jpg

From higher TFs we now the trend is bearish, so we are waiting for best entry.

1- we have an average volume down bar, with white color what represent weakness, so we wait for confirmation
2- the green colored bar represents profit taking (another confirmation for long is the green englufing candle, but we do not trade this because the trend is bearish)
3- this is the perfect high volume white bar!we have almost double top and before this perfect white bar we have bullish candle with significantly lower volume. (In my opinion this can be good entry, but Im waiting for pros to confirm this)
4- another retracement and at the end is bullish candle with narrow spread and high volume red bar, which represent market top
5- the confirmation come from the next candle, which is our first magenta color volume example(another opportunity to go short after bearish confirmation)
 
 
  • Post #23
  • Quote
  • Edited 5:43am Sep 8, 2010 3:56am | Edited 5:43am
  •  Gesek
  • | Joined May 2010 | Status: Member | 45 Posts
AUDUSD 30min:
http://i1008.photobucket.com/albums/.../AUDUSD30m.jpg

AUDUSD30min magnified:
http://i1008.photobucket.com/albums/...mmagnified.jpg

-here we have magenta volume bar= weakness

AUDUSD 15min:
http://i1008.photobucket.com/albums/.../AUDUSD15m.jpg

- we can see a big white volume bar on 15min chart

AUDUSD 5min:
http://i1008.photobucket.com/albums/...k/AUDUSD5m.jpg

- huge red volume bar on bull candle this can be the sign of the up move end, afther this we have another bull candle and the bearish candle has huge white volume which can represent the new down move, afther this we can see a small red candle(green volume bar) and two bullish candles with lower volume, which is sign of bullish weakness

Now things to consider while looking at the trade: good aud news, the main trend is up, but very significant resistance(not touched!)


I would like to edit the photos, but it is impossible, so if something is unclear according pictures tell me.
 
 
  • Post #24
  • Quote
  • Sep 8, 2010 12:43pm Sep 8, 2010 12:43pm
  •  Gesek
  • | Joined May 2010 | Status: Member | 45 Posts
Here we have the charts with the result of the trade:

15min chart:
http://i1008.photobucket.com/albums/.../15mResult.jpg

-the high volume green bar represent profit taking and consolidation, where there is no supply or demand

5min chart:
http://i1008.photobucket.com/albums/...k/5mResult.jpg

-high volume white bar, which represent high activity and can represent market bottom
-green volume bar, which means profit taking
-consolidation and market weakness after the green volume bar
-if we shorted this, wait for the decesion of the market, if it start to go against us we can exit(capture some pips-never let a winner turn into the looser) and wait for better opportunity
 
 
  • Post #25
  • Quote
  • Edited 9:25am Sep 9, 2010 7:54am | Edited 9:25am
  •  Gesek
  • | Joined May 2010 | Status: Member | 45 Posts
Volume in context

After the first learching we know what the volue bars represents, but as I said before its not enough. We must look at volume, spread and price

The spread is the difference between the high and the low of the candle(if using candlestick chart), so it is imporant to note that the high volume can be observed with wide spread and also with low spread! Inversely its also true: low volume can be observed with wide spread and also with low spread! Here is an example:
http://i1008.photobucket.com/albums/...lumespread.jpg

2- bullish cande, with an average spread and high volume red bar! magic?!
3- bearis candle, with 4-5x average spread and hmmm, volume is only average(look at the previous low volume red bar, this has even less volume!)
1- if we draw a horizontal line(can call is resistance) at the top of the bullish candle(marked 2) even the huge spread bullish candle couldnt close above the line(this huge bullish candle has also red volume bar)-this indicates weakness

Volume in context(isnt it?! ):
http://i1008.photobucket.com/albums/...sek/updown.jpg

1- high volume magenta bar, you must know what it representsAfter it there is bearis candle with even higher spread, but lower volume, in this point u must be suspicious, what is going on!So you pay attention!
2- yes this is bullish candle with red coloured high volume bar and it is going from the bottom, so we wait for the next candle: it can go up like a rocket or test the bottom once more. In this situation it would like to go down and test it, but the volume is lower(unfortunately even the spread is lower) and it can not reach the bottom
3- yes! it is going up with higher and higher volume, this indicates strength!
4- down retracement occur(stopped at 38,2 fibo, if u belive in fibo and tested it 4times- didnt marked it), where we test if there is strenght or weakness in "bullishment". In this case with the down move the volume also went down and as the signal of weakness we see low volume yellow bars.
5- we are starting to have strength again during bull candles, at this point we can go long
6- another retracement(if you watch carefully, you can see that we are testing the previous swing high), and we are happy beacuse as the price is going down the volume is also going down
7- What are you waiting for?! Yes! Go long!
8- Are you happy? It is going up and the volume is also going up afther this we see profit taking on the green color volume bar and another retracement, but this time there is higher volume than in the previous cases, so play with odds and probabilities


For example, if we are going to break resistance line there must be high volume with high spread! But its explained in the attached pdf.

Now we know, that we also have to care about spread!

The next very important "thing" is the observation of volume in context. This means that we must care about price, trend, s/r areas, spread with the context of volume!

It is very well explained in the attached pdf!

So, after we read it few(many!!!) times we will see how it works in the market, of course- through examples.
Attached File(s)
File Type: pdf VSA BASICS.pdf   665 KB | 1,786 downloads
 
 
  • Post #26
  • Quote
  • Edited 10:49am Sep 9, 2010 10:37am | Edited 10:49am
  •  lascavel
  • | Joined Oct 2008 | Status: Member | 122 Posts
Hi Gesek,

I would like to suggest that Learchers read the following documents too by Hank Prudent..

http://www.scribd.com/doc/28001517/W...-Market-Timing

It details the phases how "price structure" are played out in wyckoff analysis. This price structure are crucial in connecting the dots in VSA analysis & it should not be ignore..

Just a e.g,

Here is Chart of GBP futures today showing what & how market already anticipate the unemployment claim data 2 hours ago noting the similar schematics at play, all be it in a smaller scale, do refer the acronyms in the charts from that describe in the above-mention document.

Attached Image (click to enlarge)
Click to Enlarge

Name: ScreenHunter_01 Sep. 09 22.23.gif
Size: 26 KB


Cheers!
Las
 
 
  • Post #27
  • Quote
  • Sep 9, 2010 1:46pm Sep 9, 2010 1:46pm
  •  Porkpie
  • Joined Mar 2007 | Status: Member | 1,142 Posts
good stuff Gesek, I like your back to basics approach
 
 
  • Post #28
  • Quote
  • Sep 10, 2010 3:13am Sep 10, 2010 3:13am
  •  ninohoang
  • | Joined Jun 2008 | Status: Member | 77 Posts
Hi VSA experts,
I am new to VSA stuff. Does this VAS stuff work on high time frame charts such as H4, daily or weekly? I also heard that the true volume of Forex market does not exist. So, what kind of volume does the VSA use? Is the volume different among brokers? Thanks for your replies.
 
 
  • Post #29
  • Quote
  • Edited 7:49am Sep 10, 2010 6:11am | Edited 7:49am
  •  Gesek
  • | Joined May 2010 | Status: Member | 45 Posts
Quoting Porkpie
Disliked
good stuff Gesek, I like your back to basics approach
Ignored
Thank you Porkpie and Lascavel! I will try to insert that stuff somewhere to our learching plan. Im really trying to build this VSA learching from the absolute basic(as u also said Porkpie). And hope it will be something like this:
http://i1008.photobucket.com/albums/...BURJ-DUBAI.jpg

And special thank to Sim who gave me the first voucher.

The feedback is very important for me, especially this kind. Because it motivate me to do deeper research-analysis according VSA and to keep this tread alive until we reach the eureka moment! As I said, I have a plan according to the thread and wont give up until we will not finish all the learching lessons
 
 
  • Post #30
  • Quote
  • Sep 10, 2010 7:14am Sep 10, 2010 7:14am
  •  Gesek
  • | Joined May 2010 | Status: Member | 45 Posts
Hi Ninohoang!

I know that you are new at VSA(from the first page of our thread)

These are very good questions!!!

So I will try to answer them simply without complication:

I am new to VSA stuff. Does this VAS stuff work on high time frame charts such as H4, daily or weekly?

It is working on high time frames also. But we must consider what are we going to trade: breakouts or retracements(bounces)?trendline breakouts or s/r breakouts?counter trend trendline breakouts(so we will trade in the direction of the main trend) or the breakout of the main trendline(which will be counter trend trade)?etc
This is advanced stuff, but I hope we will be able to reach it.


I also heard that the true volume of Forex market does not exist.

If we believe that the PA in forex is randomly moving, than it is impossible to make money because of the spread. So there must be something what we beleive in, such as trends exists, there is volume which is moving the market.etc
thread for you:
Forex volume


So, what kind of volume does the VSA use?

The VSA uses tick volume.

Is the volume different among brokers? Thanks for your replies.

You can find the answer also in the thread posted above

Quoting ninohoang
Disliked
Hi VSA experts,
I am new to VSA stuff. Does this VAS stuff work on high time frame charts such as H4, daily or weekly?

It is working on high time frames also. But we must consider what are we going to trade: breakouts or retracements(bounces)?trendline breakouts or s/r breakouts?counter trend trendline breakouts(so we will trade in the direction of the main trend) or the breakout of the main trendline(which will be counter trend trade)?etc
This is advanced stuff, but I hope we will be able to reach it.


I also heard that the true volume...
Ignored
 
 
  • Post #31
  • Quote
  • Sep 10, 2010 9:46am Sep 10, 2010 9:46am
  •  ninohoang
  • | Joined Jun 2008 | Status: Member | 77 Posts
Quoting Gesek
Disliked
Hi Ninohoang!

I know that you are new at VSA(from the first page of our thread)

These are very good questions!!!

So I will try to answer them simply without complication:

I am new to VSA stuff. Does this VAS stuff work on high time frame charts such as H4, daily or weekly?

[b]It is working on high time frames also. But we must consider what are we going to trade: breakouts or retracements(bounces)?trendline breakouts or s/r breakouts?counter trend trendline breakouts(so we will trade in the direction of the main trend) or...
Ignored
Hi Gesek,
Thanks for your detailed reply. I asked because I trade only those high time frames. Hope we can get to that stuff soon. I've enjoyed and learned so much from your thread. Please, keep up the good work!!!
 
 
  • Post #32
  • Quote
  • Sep 10, 2010 9:53pm Sep 10, 2010 9:53pm
  •  Mr J
  • Joined Aug 2009 | Status: Member | 1,074 Posts
Quoting Jhig
Disliked
Same here. Well I don't want to learn it but I am interested in knowing whats it about.

Over the years I've seen multiple VSA threads and I still as of yet know what VSA is about. Is it an indicator? Because the VSA threads I've seen focused on an indicator. I think.
Ignored
It's not an indicator in the typical sense, but a method that seeks to explain the action in the market using volume, high, low, close, and in context with previous action. I think it's very worthwhile becoming familiar with it, but I don't think it would be correct to trade it as a system by itself. I think the better, successful VSA traders build on the principles, rather than look to ABC trade (i.e. a: do this, b: do this), or add it as a tool in their arsenal.

I find it interesting that it has taken such a commercial angle, and that the main group pushing it seem to be salesmen rather than traders. I do have the belief that the trader makes the method rather than the method making the trader, but surely the TG guys must understand the method, and if so, why bother selling it? I'm sure this has popped up in one of the VSA threads.
 
 
  • Post #33
  • Quote
  • Sep 11, 2010 9:42am Sep 11, 2010 9:42am
  •  PrymeTyme
  • Joined Oct 2009 | Status: 5%er Wannabe | 769 Posts
subscribed
 
 
  • Post #34
  • Quote
  • Sep 11, 2010 9:25pm Sep 11, 2010 9:25pm
  •  HiddenGap
  • Joined Aug 2009 | Status: Reading the tape | 2,324 Posts
Since we are at the beginning of this thread, I think it is a good time to offer my perspective.

"It is the intermediate trend that is of the greatest use when combined with VSA charting techniques". Tom Williams, MTM,p. 54.

It is a bit ironic that while Volume Spread Analysis is so adapt at defining turning points, it is most effective (and easiest) when used to trade trends. As retail traders, trends represent our edge. The Trend is not just our friend, it is our lover. Most traders gravitate to Volume Spread Analysis seeking following that siren's song: Buy Low and Sell High. A much more effective way to trade is to Buy high and Sell higher. What these traders fail to understand is the importance that VSA places on the concept of:

The path of least resistance :

* It takes an increase of buying, on up-days (or bars), to force the market up.
* It Takes an increase of selling, on down-days(or bars), to force the market down.
* If Selling has decreased on any down-move, the market will want to go up (No Selling Pressure).
* If Buying has decreased on any up-move, the market will want to fall (No Demand).

Couple this with an understanding of trend and we can keep it simple as we trade in harmony with the Smart Money.

Take a look at the chart below:

A1-A3: We call these candles "our old friend" in VSA because they are so telling and power when seen in the right place. Let's look at A1. It is a narrow range up candle on volume less than the previous two candles. The lack of volume tells us that the Smart Money is not interested in higher prices. If they are not interested in higher prices it must be because the expect prices to fall. From the perspective of the path of least resistance, if volume (activity) is decreasing as price rises then the path of least resistance must be down. We now know one reason that weakness when it appears, usually appears on up candles (bars).

Once we have defined the trend as down, then we can start to look for up candles on low volume.

B: Here we have a narrow range up candle on volume higher than the previous candle with price closing just above middle of the range. This is a Squat. The two keys here are the range and the close in relation to the volume. Note that volume is above average and increasing. With all that volume, how can the candle have such a narrow range? Something must be compressing the range. That something is the supply of the professional side of the market. Simply, supply must be swamping demand.
Whilst there is a buyer for every seller, this candle is telling us that a large amount of sell orders are in this area (this is where VSA has a bit of ORDER FLOW analysis in it).

As for the close, a bullish close would be higher in the range with the amount of volume seen. If we think of volume as effort, then the close does not represent to type of result we would expect to see.

On a side note, the term Squat comes from Bill Williams (Trading Chaos) and is therefore not VSA. The actual logistics of the candle's creation is pure VSA however. Bill Williams says all trends in with a squat as one of the last 1-5 intervals. I do not know if this is true. But one of the most powerful signs of weakness in VSA is End of a Rising Market. By definition, End of a Rising Market is a narrow range up candle(bar) on increasing volume preferable into new fresh territory. End of a Rising Market, therefore, is a squat.

C: Technically not an up close but an even close. Nevertheless, this is an nice example of an Up Thrust. It has an increasing range, makes a higher high than the previous two candles, has increasing volume, and closes near the low of its range. Clearly this candle cannot be strength with such a low close on that amount of volume (effort) no less. This was a stop catching maneuver. Note that the high of the Up thrust does not get as high or higher of the No Demand candle.

Most traders would benefit from letting go the their egos and trading with the trend rather than trying to be the one to pick the top or bottom...

"We have indicated already that if you are going to become a good trader, which then leads to making money in the (stock) market, you must trade with the consensus of professional opinion and not against it. This means once a move is in progress you must be able to identify the underlying trend in price movements and go with the flow..." Tom Williams, MTM, P. 50.
Attached Image (click to enlarge)
Click to Enlarge

Name: VSA5.png
Size: 110 KB
Wyckoff VSA: (1) Supply vs Demand (2) Effort vs Result (3) Cause vs Effect
 
1
  • Post #35
  • Quote
  • Sep 13, 2010 4:11am Sep 13, 2010 4:11am
  •  Gesek
  • | Joined May 2010 | Status: Member | 45 Posts
Quoting HiddenGap
Disliked
Since we are at the beginning of this thread, I think it is a good time to offer my perspective.

"It is the intermediate trend that is of the greatest use when combined with VSA charting techniques". Tom Williams, MTM,p. 54.

It is a bit ironic that while Volume Spread Analysis is so adapt at defining turning points, it is most effective (and easiest) when used to trade trends. As retail traders, trends represent our edge. The Trend is not just our friend, it is our lover. Most traders gravitate...
Ignored

Thank you very much HiddenGap, this is beautiful explanation of the VSA indicator(what are bars showing- we can see it) and what the SM is doing(what are bars telling- we can only know it).

His name is HiddenGap, and its because if he write something there is lot of valuable and hidden information, so please read this several times!

This is in perfect place, because the next learching will not be about bars, but about SM
 
 
  • Post #36
  • Quote
  • Edited 10:30am Sep 13, 2010 6:21am | Edited 10:30am
  •  Gesek
  • | Joined May 2010 | Status: Member | 45 Posts
Behind the scenes

As I mentioned earlier we are going to look what SM is doing! It is very important to know that we do not want to trade signals, but we would like to trade what are the "big dogs" trading and in which direction, so with the trend.
In the VSA BASICS pdf we have very good explanation of the accumulation, markup, distribution, mark down. Because of my english I read it lot of(belive me, enormous) times. Because, this is the thread of simplicity I would like to summarize it only in few words:

ACCUMULATION- In this phase the big dogs are buying, but they try to hide this fact, so usually the volume is low and the market is ranging. Sometimes the volume is increasing when the PA is getting higher and the volume is decreasing. This is relatively a long phase.
MARKUP- In this phase the big dogs trying to shoot the prices up on high volume and with high spread. They must break the consolidation(resistance). This is relatively a short phase.
DISTRIBUTION- the same as accumulation, but for selling
MARK DOWN- the same as markup, but for selling

-for detailed explanation read the pdf(vsa basics)

From this point we are going to analyze the market from the indicator and also SM side. This means, we will explain what the volume represents with the PA(candle, formations as doubel bottom etc.) and what is going behind the scenes. HiddenGap has a perfect example of this.

This is the theory, but now the example:

H4 chart:
http://i1008.photobucket.com/albums/...k/audchfH4.jpg

- the trend is up on the chart so we are only allowed to go long

30M chart(first seem to be a little bit crowdy, but everything must be there):
http://i1008.photobucket.com/albums/...udchf30min.jpg

1- high volume magenta bar, this represent the end of that little retracement, there is profit taking, and this magenta colored bar has higher volume than the previous volumes, so there must be some problem. From the perspective of SM we can see how they pushed down the price and it retraced back to the upper side of the candle with huge volume. This is a sign that the big players are not interested in down move. Afther the 1marked candle there is another bearish candle with lower volume than the previous 2 volumes, this means another confirmation, that there is no selling pressure
2- big bull candle(engulfs 4bear candles- very bullish sign) it has higher volume than the previous down candle, but we rather wait for confirmation.
3- uptrend with increasing volume, which is a sign of strength. From the perspective of SM we can se how the higher prices are supported by higher volume which means supported by "big dogs".
4- doji right at the previous resistance with lower volume, there is not enough support from SM to break the previous resistance level. Then we can see a a huge bear candle(englufs 4 bull candles), but the volume is lower than the previous 2candles, which is not too bearish. Here we wait for confirmation.
5- PA find the support and resistance and is consolidating. From the prespective of SM this can be disribution or accumulation- here we must take the trend(uptrend) into consideration. So we are looking at bullish sign.
6- bullish candle which has higher volume than the previous 2 volume. After it another bullish candle and again with higher volume. Afther it a doji, but closing at the upper side of the candle and again higher volume. We are very suspicious here that the markup can happen, but we are also afraid, because we see a doji(but with the VSA we also see that the doji has high volume).
7- here we have the markup. Big bull candle with high volume pushed through
the resistance. After this candle the PA is going lower to the previous resistance area, which become now the new support area, so the big dogs can buy another super big lots afther they see, that there is not enoguh strength in the down move.
8- bullis candle with much higher volume than the previous 2 volume bars, after it agother bullish candle and again with higher volume
9- start the series of bullish candles with higher and higher volume. As we said earlier, this means that the uptrend is supported by SM.
10- CAUTION! Doji with very high volume, closing in the upper side of candle, and this is green coloured bar, so there is profit taking and consolidation coming. This type is perfectly explained in HiddenGaps post at point B(squat).
11- the retracement is down and the volume is also going down, the down move is not supported from SM
12- the up move is supported from SM, but there is not enough strenght to go up through the resistance area(supply area)
13- the down move with lower volume. Again the SM is not supporting the bearish move.
14- the up move starting the volume is growing.
11-12-13-14- this is congestion area where accumulation takes place, it is called the re-accumulation
15- the huge up candle pass through the resistance are, not with huge volume, only with average(a little bit above average) volume. This is little bit tricky, because the market is not perfect. The big bullish candle is confusing, because we see higher volume and resistance break, but there is not enogh strength to continuation up move. There is rather another test of previous support. This also can be a shake-out, this means afther the breakout the traders are buying, but after this the PA is going lower so they close their long positions and open short. After the traders are short the PA can go now definitely long and this is another shake-out, because the short positions will be closed.
16- as the price is going lower the volume is also going lower
17- from this poin we can observe higher volume with up candles
18- now we are again above the resistance with ultra high volume
19- 2bearish candle with decreasing volume is indication of the bullishness. After these to bearish candles another bullish candle with higher volume. The SM is suporting the higher prices.
20- as we are going higher the volume is decreasing so we must be careful here, because there is not enough support from SM to go higher

Feel free to post your own analysis and charts as HiddenGap. I would like to thank him again for his excellent example.
 
 
  • Post #37
  • Quote
  • Edited 12:37pm Sep 13, 2010 10:38am | Edited 12:37pm
  •  Gesek
  • | Joined May 2010 | Status: Member | 45 Posts
Also read the attached pdf, lascavel posted the link to this stuff.

Here its also explained what is SM doing during accumulation, markup, distribution and mark down phase,but read it with reserve, because there are some curious things: such as during accumulation on the schematics 2 the text explains that how disribution is working, so the text is not properly connected to picture. But its very good article.

Enjoy!
Attached File(s)
File Type: pdf 28001517-Wyckoff-Schematics-Visual-Templates-for-Market-Timing.pdf   1.1 MB | 1,391 downloads
 
 
  • Post #38
  • Quote
  • Sep 13, 2010 11:47am Sep 13, 2010 11:47am
  •  Sim
  • Joined Jun 2009 | Status: Member | 2,000 Posts
Awesome thoughts here guys.. and presented oh so well

Keep it up
 
 
  • Post #39
  • Quote
  • Sep 14, 2010 4:58am Sep 14, 2010 4:58am
  •  Gesek
  • | Joined May 2010 | Status: Member | 45 Posts
Quoting Sim
Disliked
Awesome thoughts here guys.. and presented oh so well

Keep it up
Ignored
Thank you again Sim! Nice to see you here sometimes


Priceaction started thread where we are proceeding, but we have another weapon in our arsenal: the VSA. So please pay attention to this thread while we are growing with VSA, Im sure that thread will grow also and at the end we will connect the knowledges:
Supply, Demand & Bollinger Bands
 
 
  • Post #40
  • Quote
  • Sep 15, 2010 2:03pm Sep 15, 2010 2:03pm
  •  Gesek
  • | Joined May 2010 | Status: Member | 45 Posts
OK, so you can speculate what happened here and try to analyze the trade for yourself or even better: for us(write down) what do u think!
http://i1008.photobucket.com/albums/...1magnified.jpg
 
 
  • Trading Discussion
  • /
  • VSA learching
  • Reply to Thread
    • 1 Page 234 5
    • 1 Page 234 5
0 traders viewing now
  • More
Top of Page
  • Facebook
  • Twitter
About FF
  • Mission
  • Products
  • User Guide
  • Media Kit
  • Blog
  • Contact
FF Products
  • Forums
  • Trades
  • Calendar
  • News
  • Market
  • Brokers
  • Trade Explorer
FF Website
  • Homepage
  • Search
  • Members
  • Report a Bug
Follow FF
  • Facebook
  • Twitter

FF Sister Sites:

  • Metals Mine
  • Energy EXCH
  • Crypto Craft

Forex Factory® is a brand of Fair Economy, Inc.

Terms of Service / ©2023