DislikedGreat Trade !
Good Job
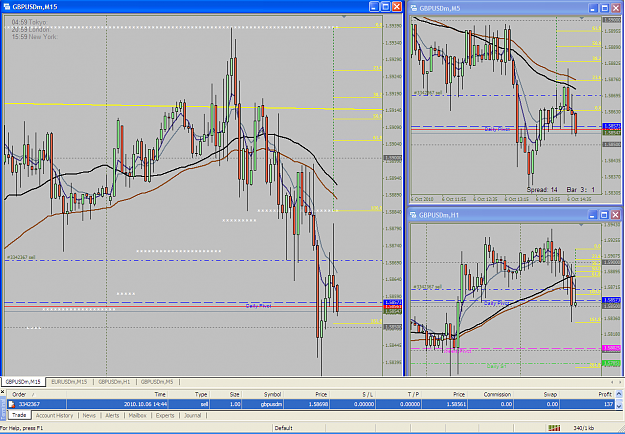
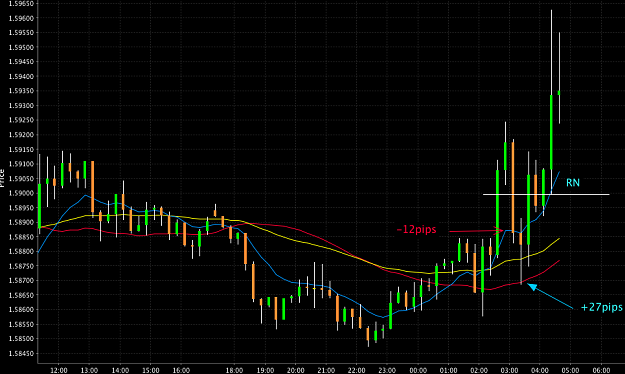
What MA is the yellow one on you M15 chart ?
Also I noticed you have also other MAs (the gray ones) on the chart. Are they the ones of higher TF, with the indicator posted in the Dance Thread ?
Thank youIgnored
1. H1 (EMA10 gray, MA35 black, EMA50 brown, EMA62 red, SMA200 yellow). Also using the DanceMovingAverages MTF indicator I have the H4 10and H4 35. Two-three times per day I change H1 to H4 or to Daily to see what's happening there.
2. M15 (EMA5 thin yellow, EMA10 gray, MA35 black, EMA50 brown, EMA62 red, SMA200 yellow). Also using the DanceMovingAverages MTF indicator I have the H1 10 and H1 35. At the start of the day I change this to H4 and I mark the support/resistance from the edges of the H4 bars (these are the straight yellow lines)
3. M5 (EMA5 thin yellow, EMA10 gray, MA35 black, EMA50 brown, EMA62 red, SMA200 yellow). Also using the DanceMovingAverages MTF indicator I have the M15 10 and M15 35.
4. M1 (EMA75 i.e. M15 5, SMA525 i.e M15 35, EMA750 i.e. M15 50, EMA 200).
From these I use mostly the M15 10,35,50, H1 10,35,50,62, H4 10, M5 10,35,50. The rest just help me understand the bounces and I also sometimes use the rest for targets (specially when they confluence with RNs, pivots).