DislikedNot sure about all this yet, but I can already tell you I view the market through a different lens the last few weeks.
See attached usdcad 4h chart.
Solid downtrend on both weekly and daily chart. 4h retraced quite a bit, and formed an 8hr PB (fuse the two together in your mind), and notice the bar with green arrow engulfs the previous bar. I'd like to see the body of candle 2 bigger than candle 1, but the true hi and low still engulf candle 1. Joe Ross calls these "gimme bars". "gimme the money".
Just curious what others think.Ignored
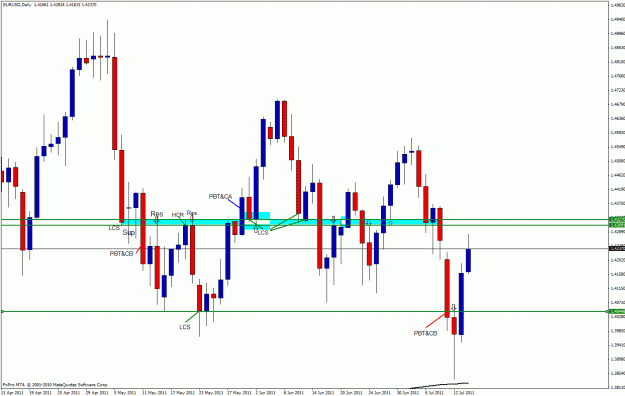
As we know . .PA is one thing . .Location of where they form is another and more important.
What does your Daily PPZ levels look like as they relate to that 8 Hour PB? Or even the 8 Hour PPZ levels?
Jim
Indicators show the past. Price Action "Indicates" the future.