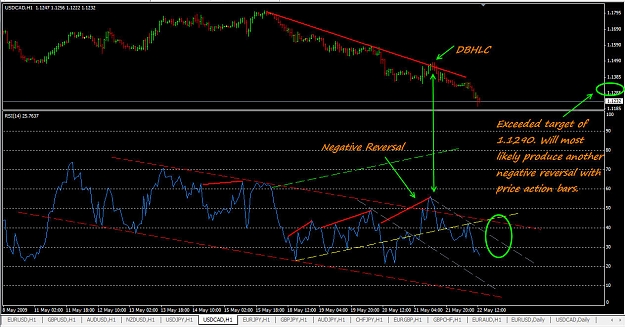
This DBHLC with confirmation on RSI with a Negative Reversal has now exceeded it's target of 1.1290. It will most likely reset into another Negative Reversal with a new and lower price target. Depending on market momentum it could be today or Sunday night/Monday.
This DBHLC with confirmation on RSI with a Negative Reversal has now exceeded it's target of 1.1290. It will most likely reset into another Negative Reversal with a new and lower price target. Depending on market momentum it could be today or Sunday night/Monday.
Ignored
To tell the truth bro,the cable,and buck have ,well being going out of there normal,limit's,and it's becoming a problem placing and exiting trade's,just waiting if this hinderance would die off soon..let's see how she play's out...
To tell the truth bro,the cable,and buck have ,well being going out of there normal,limit's,and it's becoming a problem placing and exiting trade's,just waiting if this hinderance would die off soon..let's see how she play's out...
Ignored
I'm not getting back in but 347 pips since DBHLC with Negative Reversal earlier in the week. No hurry. It's Friday.
Joined Jul 2007
|
Status: Screw Long Term 5min For Life!
|1,259 Posts
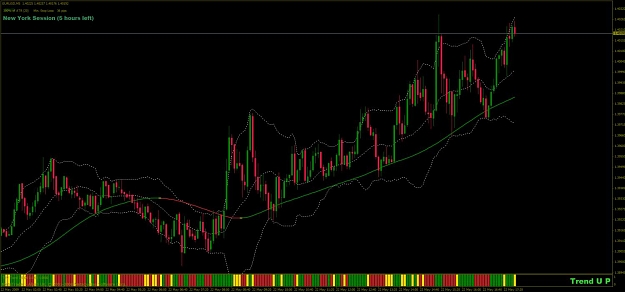
Not to hard, buy the pullbacks as long at the 15-30min say it's a UP trend... It's like playing Where is waldo with PB's but if you are playing the trend with them and have a stop below the last low it's a game you can not lose in the long run.
Not to hard, buy the pullbacks as long at the 15-30min say it's a UP trend... It's like playing Where is waldo with PB's but if you are playing the trend with them and have a stop below the last low it's a game you can not lose in the long run.
Ignored
Interesting, what are those dashed lines? Bollinger Bands? And whats the dashed line in the middle? Sorry if these are stupid q's
Not to hard, buy the pullbacks as long at the 15-30min say it's a UP trend... It's like playing Where is waldo with PB's but if you are playing the trend with them and have a stop below the last low it's a game you can not lose in the long run.
Welcome!Have Rock-solid Patience & Determination, Never stop Learning & Good luck!
ykramesh,
No worries, I've blown more accounts than u did.
After u learn & earn.... don't forget to pay it forward. & never stop until u get to change this " A master in the making" to this ---- "A made master"
Ok. Seriously I had all these lines on the chart before they were reacted too. Most derived from a close price "low or high" somewhere.
For clarity of explanation I've removed some EMAs, a pivot indicator and fib studies.
Top light blue line bar high trend line from 1 hour. (not respected very well 3 hours ago. ...Yes this is a <GASP> ...five minute chart!!! )
Top dotted yellow horizontal line is minor PPZ that's closest to lining up with those yellow trend lines of a) close price 1 hr trend line. b) Bar lows trend line...
Ignored
This is a little beyond my comprehension abilities right now, but really great stuff. Definitely saving this, ty bundy
|
Joined May 2009
|
Status: lost in the void
|2,977 Posts
hello there,
i am new to this forum and this thread, is is still active based on the price action charts posted within the beginning of this thread?
i am really interested in learning more about price action and trading the currency market in general with keeping it simple stupid.
how to find a good start into it, i am willing to learn but i do not have this much time cause of a full time job to sit in front of charts and analyse.
Maybe 5-6 hours a day i would like to spend on trading, what kind of timeframe you could suggest? I am european. Also i do not have deep pockets and my plans were (actually after spend some time trading "demo") to sign up for a micro account.
So my capital investement would be a few bucks maybe $1.000-2.500 for going live. It´s not much i know but i allready blowed up a live account in the past.
So, all in one. I am looking for some advices from some more experienced traders on how to find a good start into this as a business with proper money management rules and a working strategy for a beginner based on price action with some clear and simple entry/exit book profit rules which are not so hard to follow/understand for a newbie. I am not a greedy person so i don´t expect to get rich with some month of trading lol. But it shouldn´t get boring too. I think specially for a beginner it´s important to have at least 1-2 trades a day to learn from, or am i completely wrong? :-)
bro..for the past few day's we have had some bizzare movement around ,since the cable manipulation on monday..i will suggest you add a little volune to you trading analysis,so you don't get caught in the cross fire,BOJ,BOE,FEDS affairs
i am new to this forum and this thread, is is still active based on the price action charts posted within the beginning of this thread?
i am really interested in learning more about price action and trading the currency market in general with keeping it simple stupid.
how to find a good start into it, i am willing to learn but i do not have this much time cause of a full time job to sit in front of charts and analyse.
Maybe 5-6 hours a day i would like to spend on trading, what kind of timeframe you could suggest? I am european....