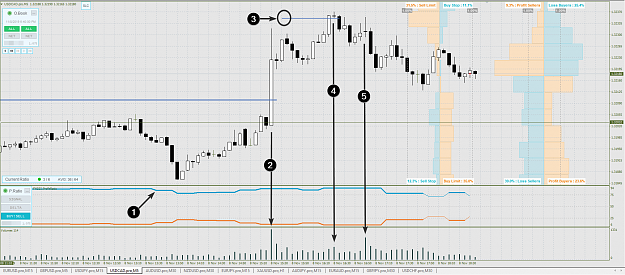
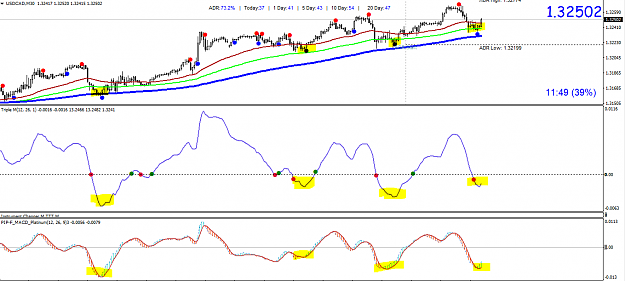
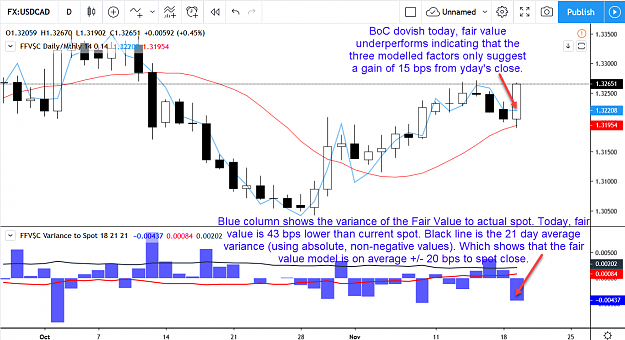
• Home
  • Forums
  • Trades
  • News
  • Calendar
  • Market
  • Brokers
  • Login
  • Join
  • User/Email: Password:
  • 12:56pm
Menu
  • Forums
  • Trades
  • News
  • Calendar
  • Market
  • Brokers
  • Login
  • Join
  • 12:56pm
Sister Sites
  • Metals Mine
  • Energy EXCH
  • Crypto Craft

Options

Bookmark Thread

First Page First Unread Last Page Last Post

Printable Version

  • Interactive Trading
  • /
  • Reply to Thread
  • Subscribe
  • 4,913
Attachments: USD/CAD
Exit Attachments

USD/CAD

  • Last Post
  •  
  • 1 770771Page 772773774 795
  • 1 Page 772 795
  •  
  • Post #15,421
  • Quote
  • Nov 8, 2019 11:31am Nov 8, 2019 11:31am
  •  Unbiased
  • | Commercial Member | Joined Sep 2019 | 249 Posts
Quoting Unbiased
Disliked
Bread & Butter sell in USD/CAD Fundamentals: USDCAD retraced up by dint of dovish BOC statement today (BOC may cut Overnight Rate in Jan). Then Fed rate cut of 25bp was announced later today. But at present, the fact is rate cut by Fed and no rate cut by BOC and dovish BOC has already been priced in. Therefore, recent dovish FOMC press conference will push USD/CAD down again a little bit and it can reach 1.3105 (± 3.0) pips that is FIB61.8 of whole move up since yesterday. Technical analysis: A downward thrust that makes a ground of bread and butter,...
Ignored
This Bread and Butter was not completed because its classical target FIB61.8 (1.3105) was not hit, however it has come down below FIB50.0 and returned up without touching FIB61.8 (1.3105). However, the fall was enough to set my SL to BE in sell trade which got stopped out at BE (no Profit/Loss).

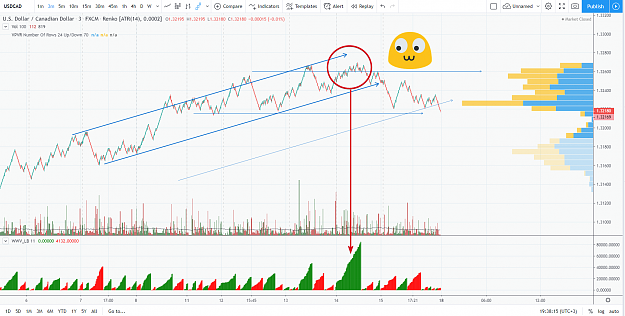
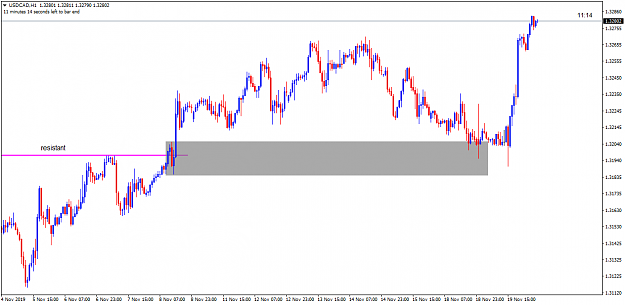
Now USD/CAD shows a new scenario which I am posting next.
  • Post #15,422
  • Quote
  • Nov 8, 2019 11:32am Nov 8, 2019 11:32am
  •  Unbiased
  • | Commercial Member | Joined Sep 2019 | 249 Posts
USD/CAD analysis | Nov 08, 2019

Fundamental:


About USD

Last US-NFP came to be 128K vs forecast 90K. Revision of previous NFP was also significantly positive, revised from 136K to 180K.

US-China trade deal has been making positive progress. Trump is trying his best to have a good deal ahead of 2020 US presidential election.

Hence, overall outlook seems positive.


About CAD

Last GDP release was 0.1% less than forecast. Probability of upcoming policy rate cut by BOC has Kept CAD restrained, CAD has lost against USD whereas other currencies like AUD, NZD and EUR had gained against USD in last week of Oct .

Today released employment data came to be -1.8K vs forecast 14.7K.

Hence, recent outlook seems negative.


Technical:


BC move made a small bullish gartley shown in yellow color, so CAD was moving up and broke high of Oct 30 (BOC statement day) right after today's release of employment data.

ABCD100.0 coincides with FIB78.6 of the whole swing down, which makes this area important. This is the next target of USD/CAD.

Attached Image (click to enlarge)
Click to Enlarge

Name: USD CAD_Nov 09_2019.png
Size: 49 KB

  • Post #15,423
  • Quote
  • Nov 8, 2019 11:52am Nov 8, 2019 11:52am
  •  olegchartist
  • Joined Sep 2019 | Status: Member | 230 Posts
In my thread I use 10 Chart Reading Sings:

weakness: EVRT, SLKT, ND, SB, FOMO
strength: EVRB, SLKB, NS, DB, PANIC

What is important - there is a logical and rational place for the appearance of each of these bars. I am talking about the general market context. How one particular bar fits into the general market sentiment.

Let's look at a good example of the appearance of an EVRT bar. Data from USDCAD market, 15m TF. This is a sign of weakness that occurs at almost every peak in the market.

1) We had a large number of buyers in profit. This means that the market is not very happy to grow up, because the rising price will further increase the profits for bulls. Therefore, day traders (who want to trade against the Crowd) can plan shorts. Although this may seem risky, there’s no chance to get away from risks if you are trading forex. The main thing is that the risk should be justified and limited.

2) Then there was a bullish breakout. The number of buyers’ profits surged even more. The likelihood of some decline has increased. At what level do you plan shorts entries?

3) The Stop Loss indicator gives a hint. Here sellers set protective orders. And the cruel market will probably want to trigger them, before starting to decline. So there is an idea to sell from this level.

4) And when the market reaches this level (actually - 1.3236), then we have EVRT. Narrow range, volume increased, no bullish progress. Please note that the previous bar made more bullish progress on a relatively smaller volume. Therefore, we can state the appearance of a signal of weakness. Professional sellers used this penetration of the previous high to open more short positions. The next bar closed below and gave confirmation.

5) There is a surge in volume. Well, let's assume it was a good quality demand (signal of strength). If so, why is the closing price so low? And why the next bar has a wide spread and close at a minimum.

Okay.. The chart told us the story of the bearish reversal. Late buyers participated in it. As well as sellers who were shaken out of positions on the eve of the decline. Keeping short-term longs in such a situation becomes dangerous.

Follow my thread
Attached Image (click to enlarge)
Click to Enlarge

Name: pNEuckI.png
Size: 96 KB
Oleg Alexandrov, market analyst. Find me in Google
1
  • View Post
  • Hidden for breach of Trader Code of Conduct
  • humantrader
  • Post #15,425
  • Quote
  • Nov 12, 2019 6:40am Nov 12, 2019 6:40am
  •  FXTradings
  • | Commercial Member | Joined Jul 2019 | 108 Posts
I think at 1.3270 is a sell trade possible on USDCAD
Attached Image (click to enlarge)
Click to Enlarge

Name: USDCADDaily.png
Size: 68 KB
1
  • Post #15,426
  • Quote
  • Nov 12, 2019 8:04am Nov 12, 2019 8:04am
  •  Unbiased
  • | Commercial Member | Joined Sep 2019 | 249 Posts
Quoting Unbiased
Disliked
USD/CAD analysis | Nov 08, 2019 Fundamental: About USD Last US-NFP came to be 128K vs forecast 90K. Revision of previous NFP was also significantly positive, revised from 136K to 180K. US-China trade deal has been making positive progress. Trump is trying his best to have a good deal ahead of 2020 US presidential election. Hence, overall outlook seems positive. About CAD Last GDP release was 0.1% less than forecast. Probability of upcoming policy rate cut by BOC has Kept CAD restrained, CAD has lost against USD whereas other currencies like AUD,...
Ignored
Moved SL to BE.
  • Post #15,427
  • Quote
  • Nov 12, 2019 8:10am Nov 12, 2019 8:10am
  •  vincentprice
  • Joined Dec 2009 | Status: Nil Desperandum | 389 Posts
Quoting FXTradings
Disliked
I think at 1.3270 is a sell trade possible on USDCAD {image}
Ignored

I am looking for a reaction at a slightly higher price from the same resolved S/R level.

https://www.forexfactory.com/showthr...0#post12611840
Nil desperandum
  • Post #15,428
  • Quote
  • Nov 12, 2019 8:41am Nov 12, 2019 8:41am
  •  FXTradings
  • | Commercial Member | Joined Jul 2019 | 108 Posts
Quoting vincentprice
Disliked
{quote} I am looking for a reaction at a slightly higher price from the same resolved S/R level. https://www.forexfactory.com/showthr...0#post12611840
Ignored
1.3287 is of course better for sell entry, i would als just look for somethink like 50 pips.
  • Post #15,429
  • Quote
  • Nov 12, 2019 9:58am Nov 12, 2019 9:58am
  •  John1974
  • | Joined Nov 2019 | Status: Junior Member | 9 Posts
Usdcad buy limit 1.31818
sl 1.31152
tp 1.33408
Attached Image (click to enlarge)
Click to Enlarge

Name: usdcad.jpg
Size: 149 KB
1
  • Post #15,430
  • Quote
  • Nov 13, 2019 5:55am Nov 13, 2019 5:55am
  •  artestine
  • Joined Sep 2015 | Status: Member | 70 Posts
Quoting artestine
Disliked
{quote} I would start to close all the sell positions on USDCAD and start to search for long opportunities when right setups appear
Ignored
Here we go! Time to close long positions and start selling.
UC is too easy to trade
Give me a lever long enough and a place to stand, and I will move the Earth
  • Post #15,431
  • Quote
  • Nov 13, 2019 1:51pm Nov 13, 2019 1:51pm
  •  OhComeOn
  • Joined Feb 2017 | Status: Member | 807 Posts
Long on UC right now using 30M chart.
Attached Image (click to enlarge)
Click to Enlarge

Name: Capture.PNG
Size: 39 KB
1
  • Post #15,432
  • Quote
  • Nov 16, 2019 11:39am Nov 16, 2019 11:39am
  •  olegchartist
  • Joined Sep 2019 | Status: Member | 230 Posts
This is an EVRT example

Note, how price losing ability to
bounce up from support channel lines
and reach resistance channel lines

Attached Image (click to enlarge)
Click to Enlarge

Name: nLo7p3N.png
Size: 169 KB


Why EVRT is a bearish sign?
Oleg Alexandrov, market analyst. Find me in Google
  • Post #15,433
  • Quote
  • Nov 17, 2019 10:55pm Nov 17, 2019 10:55pm
  •  mrzee90
  • | Joined May 2019 | Status: Member | 124 Posts
USDCAD TRADE PLAN
Attached Image (click to enlarge)
Click to Enlarge

Name: USDCADH1.png
Size: 32 KB
Beat the enemy plan before its made :)
  • Post #15,434
  • Quote
  • Edited at 2:03pm Nov 19, 2019 1:43pm | Edited at 2:03pm
  •  Unbiased
  • | Commercial Member | Joined Sep 2019 | 249 Posts
USD/CAD and CAD/JPY analysis

Besides our existing bearish bias on JPY pairs (bullish on JPY); today's tweet1 and tweet2 create uncertainty about US-China trade deal which makes JPY (the save haven) even more bullish/stronger.

Our previous USD/CAD scenario already shows that we've recently been bearish in CAD. CAD resumed its fall/rise in USD/CAD after a minor downward retracement at USD/CAD. Since we are bearish in USD/JPY, we have now preferred to sell CAD/JPY instead of buying USD/CAD. However, we may tomorrow close CAD/JPY and enter buy in USD/CAD if FOMC will be hawkish.

Alternative idea: half trade (a sell in CAD/JPY) and half trade (a buy in USD/CAD) can be done together.

Basically we have to sell CAD again and we should sell it against the strongest one. If you have read my post on USD/CHF, you know that I have closed re-entered sell of USD/CHF today; which means that I am no longer considering CHF strong. Therefore, re-entered sell of CAD/CHF trade (view its comment) has also been closed at BE. Hence we had to find another strong currency against which we could resume selling CAD.

Here is what I see on CAD/JPY charts.

On H4 time-frame: A 3 drive look alike pattern is under construction:

Attached Image (click to enlarge)
Click to Enlarge

Name: CAD JPY_Nov 19_2019.png
Size: 46 KB


On daily/D1 time-frame:

ABCD100.0 is our minimum target/TP. All other targets such as 3-drive completion point (80.368), FIB61.8 of the whole swing up (81.233) and abcd100.0 are beyond it.

Set SL above yesterday's high/point c.

Attached Image (click to enlarge)
Click to Enlarge

Name: CAD JPY_D1_Nov 19_2019.png
Size: 41 KB

  • Post #15,435
  • Quote
  • Edited at 2:36pm Nov 19, 2019 1:59pm | Edited at 2:36pm
  •  Vengeance
  • | Joined Nov 2009 | Status: Member | 188 Posts
It's been sometime since visiting FF! 5 years? Good to see some are keeping the $/CAD thread alive. After thumbing through a number of posts to see what you are all chatting about, here is some food for thought:

1. USD/CAD can be a difficult pair to trade, but mainly because many do not realize that this pair spends the bulk of its time in a trading range. Trends tend to be fairy short and violent. Each ccy has its own idiosyncrasies and CAD's is lot of time ranging followed by relatively quick moments of trending. As such, if you use tactics that are more geared to trending rather than range trading (though you still need both), it is likely to be a difficult pair to trade. I would suggest some cycle analysis to give you and idea of how long CAD cycles (e.g. low to low, high to high, peak to trough) last for and what you can expect, at least on the higher time frames.

2. As olegchartist suggests (seems he posted a tutorial (on his own unique version?) of how to read a chart. I can't speak to its usefulness as I haven't read it, but the analysis I read above was... interesting... Regardless, he has the right idea to look at bars in terms of supply/demand), price action analysis is very useful because candlestick/bar analysis is analyzing actual price action whereas indicators are derivatives of price and therefore will always, to a lesser or greater extent, lag price. Not only that, the insight one can try and glean from how the market on the whole is positioning and/or viewing recent moves can be quite helpful in confirming or rejecting your current/next trade hypothesis. To that end, I would suggest boning up on price action analysis (large part of what I personally use). Accordingly, look at price action in conjunction with any indicators. Using volume to confirm patterns is a bit difficult in FX, but tick volume (measure of activity rather than true $ volume) should still be representative, and useful. Depending on the pairs you trade or are analyzing, I would suggest using the futures market on the CME as they offer real volume. If you trade $/CAD, look at CAD futures (https://www.cmegroup.com/trading/fx/...an-dollar.html).

3. Useful or not, USD/CAD's price is fairly correlated with moves in oil (WTI), risk sentiment (stock prices via S&P 500 and Canada's TSX) and the spread between the 2 year US and Canadian government bond yields. On any given day, I have found that these three simple items can account for around two-thirds of the day's move. On a quiet day (i.e. no economic data of note or market moving events), they can account for nearly 100% of the day's moves. On some days, like when thre is large event that moves markets, these factors will not tell the whole story of the day's price move. They are useful to keep an eye on, but be warned that using them in a model, as I do, is a coincident indicator in that they do not predict the price other than to say what these factors consider to be "fair value" on a given day. As such, to use them as a predictive tool is likely to end badly, but they do help give clues as to what is driving price action in the pair and if there is a possibility for price to revert to "fair value" or vice versa. Useful or not? At best, moderately useful (see graphic).

12:30pm MST: Just edited to put up a chart with a simple candlestick pattern analysis and price filter to highlight how price action near alone is a very powerful tool. In my experience, most candlestick patterns are 50/50 but a few coupled with filters can be very enlightening.
Attached Images (click to enlarge)
Click to Enlarge

Name: 2019-11-19_11-45-03.png
Size: 146 KB Click to Enlarge

Name: 2019-11-19_12-21-24.png
Size: 108 KB
  • Post #15,436
  • Quote
  • Nov 19, 2019 2:19pm Nov 19, 2019 2:19pm
  •  Unbiased
  • | Commercial Member | Joined Sep 2019 | 249 Posts
Quoting Unbiased
Disliked
USD/CAD and CAD/JPY analysis Besides our existing bearish bias on JPY pairs (bullish on JPY); today's tweet1 and tweet2...
Ignored
CAD/JPY fell 30.0 pips from my selling point by the time I finished writing and publishing this analysis, so I moved SL to BE.
  • Post #15,437
  • Quote
  • Nov 19, 2019 6:25pm Nov 19, 2019 6:25pm
  •  Unlimted
  • | Joined Nov 2019 | Status: Member | 2 Posts
Quoting Vengeance
Disliked
It's been sometime since visiting FF! 5 years? Good to see some are keeping the $/CAD thread alive. After thumbing through a number of posts to see what you are all chatting about, here is some food for thought: 1. USD/CAD can be a difficult pair to trade, but mainly because many do not realize that this pair spends the bulk of its time in a trading range. Trends tend to be fairy short and violent. Each ccy has its own idiosyncrasies and CAD's is lot of time ranging followed by relatively quick moments of trending. As such, if you use tactics that...
Ignored
BOC Wilkins made statements today that despite global uncertainty she says "Canada's financial system is resilient and we are in a good position to deal with whatever comes our way.". It seemed it was a bullish comment.

However CAD was down across all major currencies, can you explain why?
  • Post #15,438
  • Quote
  • Nov 19, 2019 8:37pm Nov 19, 2019 8:37pm
  •  Vengeance
  • | Joined Nov 2009 | Status: Member | 188 Posts
Quoting Unlimted
Disliked
{quote} BOC Wilkins made statements today that despite global uncertainty she says "Canada's financial system is resilient and we are in a good position to deal with whatever comes our way.". It seemed it was a bullish comment. However CAD was down across all major currencies, can you explain why?
Ignored
Add to the below that Canadian economic data has been flagging and Citi's economic surprise index has turned below zero lower for the first time since Dec 2018 meaning that Canadian data is surprising to the downside of consensus forecast.

From Wilkins' speech (https://www.bankofcanada.ca/2019/11/...certain-world/) she starts off strong, but it goes downhill from there>

"The Canadian economy is performing relatively well overall. Inflation is close to target, the unemployment rate is near historic lows, and wage growth has picked up. "

"There are, nonetheless, important regional differences. The Quebec economy is performing particularly well these past few years, bringing many people back to work. However, the ongoing adjustment to lower oil prices continues to weigh on economic activity in the energy-producing provinces, causing hardship for many people.

Beyond our shores, the global economy is facing immense challenges. The trade war between the United States and China is top of mind for all of us. Yes, there is a possibility of an initial deal. Still, uncertainty about trade policy remains high. This uncertainty has caused a global slowdown and even fears of a global recession—though most baseline forecasts, including our own, don’t call for one. Even if the trade war doesn’t get any worse, by 2021 it could cost around US$1 trillion in lost economic output around the world. As you saw in our latest Monetary Policy Report (MPR), Canada’s being hit too, but a domestic recession isn’t in our forecast either.

The trade war isn’t the only source of uncertainty. There’s Brexit, tensions in the Middle East and social unrest in Hong Kong and some countries in Latin America. Risk managers here today know how difficult it is to design business strategies in this environment."

"The global context has worsened, increasing risks to the global expansion and chances of financial stress. Participants in our latest Financial System Survey would agree. The trade war is a major concern."

"It’s important to note that in our adverse scenario in the October MPR inflation declines but stays within the inflation-control range of 1 to 3 percent. Our policy interest rate may be relatively low now, but at 1.75 percent we still have room to manoeuvre. And, we have other options in our tool kit, such as extraordinary forward guidance and large-scale asset purchases."

"Numerous financial vulnerabilities at the global level are all related to the usual suspect: leverage. Total global debt is now more than 3 times global gross domestic product (GDP), much higher than it was before the Great Recession. This leaves many households, businesses and governments exposed should their financial situations deteriorate. It also means that an economic downturn could be deeper than usual and fraught with financial stresses."
  • Post #15,439
  • Quote
  • Nov 19, 2019 9:13pm Nov 19, 2019 9:13pm
  •  Unbiased
  • | Commercial Member | Joined Sep 2019 | 249 Posts
Quoting Unbiased
Disliked
USD/CAD analysis | Nov 08, 2019 Fundamental: About USD Last US-NFP came to be 128K vs forecast 90K. Revision of previous NFP was also significantly positive, revised from 136K to 180K. US-China trade deal has been making positive progress. Trump is trying his best to have a good deal ahead of 2020 US presidential election. Hence, overall outlook seems positive. About CAD Last GDP release was 0.1% less than forecast. Probability of upcoming policy rate cut by BOC has Kept CAD restrained, CAD has lost against USD whereas other currencies like AUD,...
Ignored
The (very next) target of this analysis has been reached.
  • Post #15,440
  • Quote
  • Nov 19, 2019 11:51pm Nov 19, 2019 11:51pm
  •  mrzee90
  • | Joined May 2019 | Status: Member | 124 Posts
Quoting mrzee90
Disliked
USDCAD TRADE PLAN {image}
Ignored
90 PIPS and still counting
Attached Image (click to enlarge)
Click to Enlarge

Name: USDCADH1.png
Size: 30 KB
Beat the enemy plan before its made :)
1
  • Interactive Trading
  • /
  • USD/CAD
  • Reply to Thread
    • 1 770771Page 772773774 795
    • 1 Page 772 795
0 traders viewing now
  • More
Top of Page
  • Facebook
  • Twitter
About FF
  • Mission
  • Products
  • User Guide
  • Media Kit
  • Blog
  • Contact
FF Products
  • Forums
  • Trades
  • Calendar
  • News
  • Market
  • Brokers
  • Trade Explorer
FF Website
  • Homepage
  • Search
  • Members
  • Report a Bug
Follow FF
  • Facebook
  • Twitter

FF Sister Sites:

  • Metals Mine
  • Energy EXCH
  • Crypto Craft

Forex Factory® is a brand of Fair Economy, Inc.

Terms of Service / ©2021