Hi Chris,
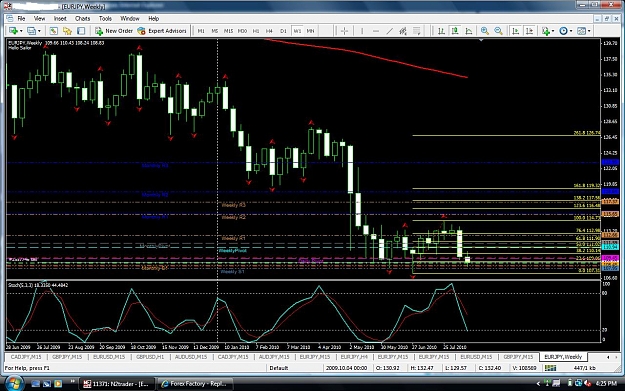
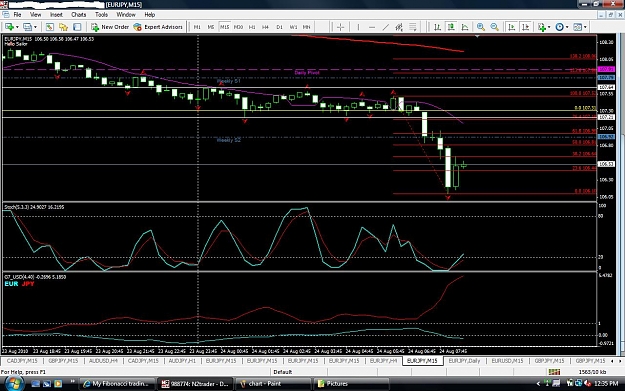
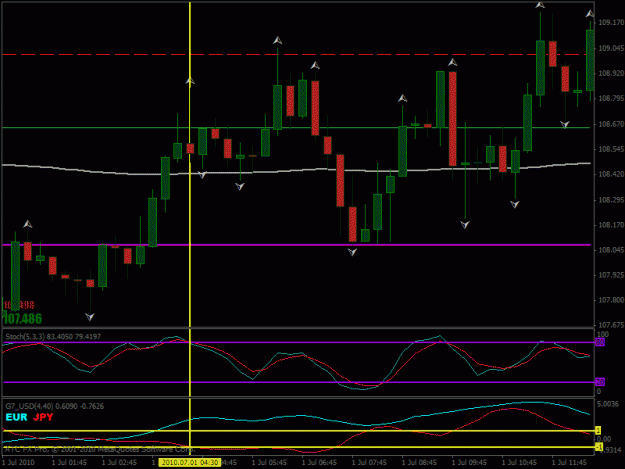
you have plotted the exact chart i have posted. I am already in this trade. If you notice the stocks are already down again which means it will go and hit 61.8 again after market opens and then turn down for the huge sell that i am waiting for. Here i am plotting a weekly fibs again. Notice the fibs levels on this.
Chart 1. weekly chart with weekly fibs from high to low.
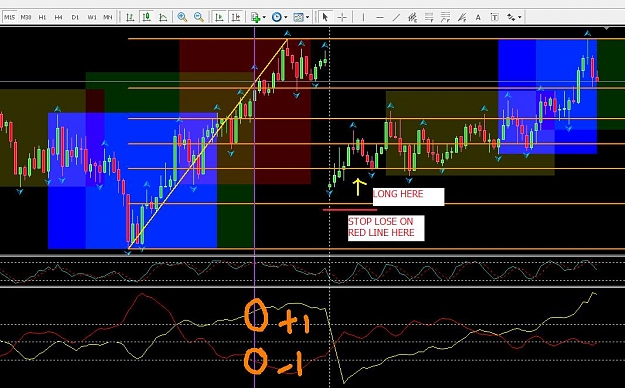
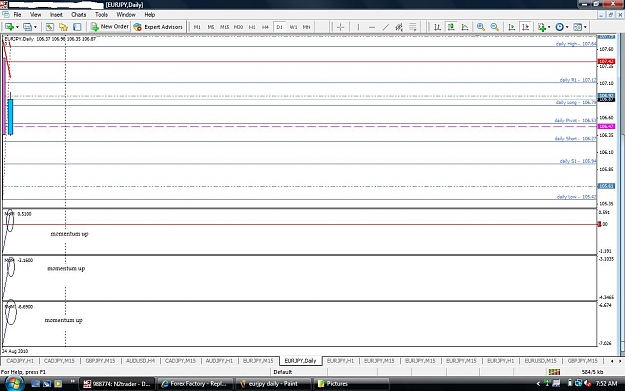
Chart 2. 15 minutes chart with weekly fibs.
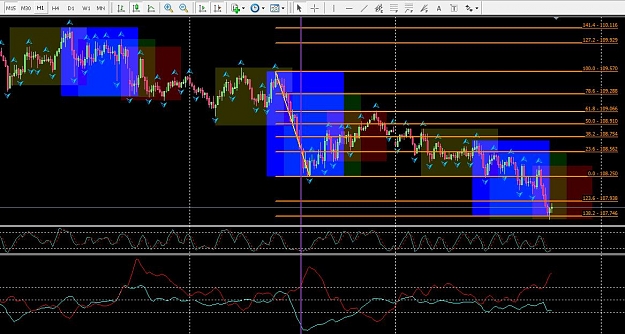
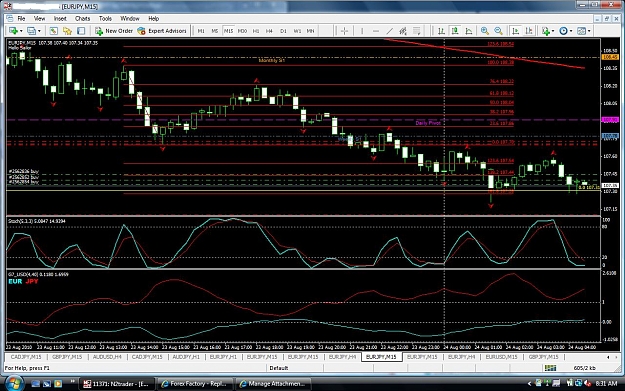
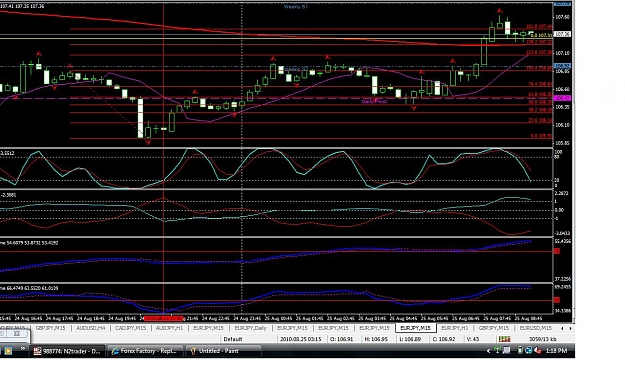
chart 3 . 15 minute setup with fibs. Yellow fibs are weekly and red is the 15 minutes fib.
Tell me what do you notice....
STING
