Fibonacci's levels: possibilities of use from the point of view of statistics
Roman Mamchits 19:26, 03.02.2010
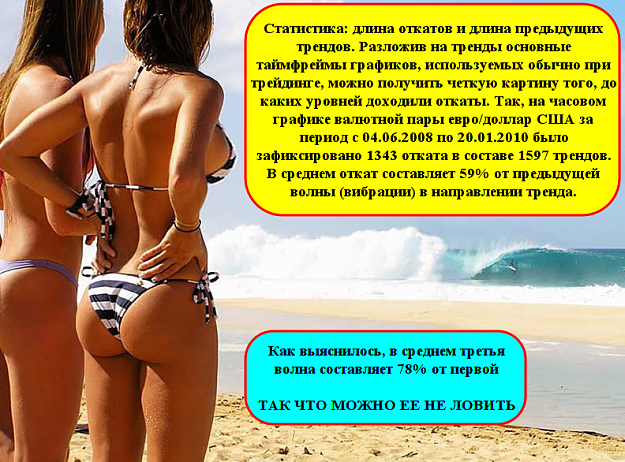
Statistics: length of kickbacks and length of the previous trends. Having spread out the main taymfreyma of the schedules used usually when trading to trends it is possible to receive an accurate picture of what levels were reached by kickbacks. So, on the hour schedule of a currency pair of euro/US dollar from 04.06.2008 1343 kickbacks as a part of 1597 trends were recorded till 20.01.2010. Kickback averages 59% of the previous wave (vibration) in the direction of a trend. The error concerning Fibonacci's level of 61.8% makes less than 5% that to measures of the technical analysis is acceptable. The dispersion of indicators not really big, however, exists a certain dependence on number of a wave of kickback.
As it became clear, the third wave averages 78% from the first, fifth wave — 77% from the third, seventh wave — 80% from the fifth, ninth wave — 83% from the seventh, eleventh wave — 83% from the ninth, thirteenth wave — 94% of the eleventh. There is no wave which on average would be more previous. Therefore it is possible to consider that it doesn't make sense to catch the third wave: it is much simpler to enter all trends along the dominating trend. To any concrete level of Fibonacci the binding isn't present, however it is possible to conclude that the range of values is between 76.4% and 100%. About any levels more than 100% the speech doesn't go. In this regard and trade on breakdown of the previous fractal as it is accepted in the classical technical analysis — when the trader opens a position as soon as the wave in the direction of the dominating trend punches the level of the end of the previous wave in the same direction — it is also possible to call into question as in this case the considerable part of already short trend is lost.
Roman Mamchits 19:26, 03.02.2010
Statistics: length of kickbacks and length of the previous trends. Having spread out the main taymfreyma of the schedules used usually when trading to trends it is possible to receive an accurate picture of what levels were reached by kickbacks. So, on the hour schedule of a currency pair of euro/US dollar from 04.06.2008 1343 kickbacks as a part of 1597 trends were recorded till 20.01.2010. Kickback averages 59% of the previous wave (vibration) in the direction of a trend. The error concerning Fibonacci's level of 61.8% makes less than 5% that to measures of the technical analysis is acceptable. The dispersion of indicators not really big, however, exists a certain dependence on number of a wave of kickback.
As it became clear, the third wave averages 78% from the first, fifth wave — 77% from the third, seventh wave — 80% from the fifth, ninth wave — 83% from the seventh, eleventh wave — 83% from the ninth, thirteenth wave — 94% of the eleventh. There is no wave which on average would be more previous. Therefore it is possible to consider that it doesn't make sense to catch the third wave: it is much simpler to enter all trends along the dominating trend. To any concrete level of Fibonacci the binding isn't present, however it is possible to conclude that the range of values is between 76.4% and 100%. About any levels more than 100% the speech doesn't go. In this regard and trade on breakdown of the previous fractal as it is accepted in the classical technical analysis — when the trader opens a position as soon as the wave in the direction of the dominating trend punches the level of the end of the previous wave in the same direction — it is also possible to call into question as in this case the considerable part of already short trend is lost.
Attached Image (click to enlarge)
Attached File(s)