• Home
  • Forums
  • Trades
  • News
  • Calendar
  • Market
  • Brokers
  • Login
  • Join
  • User/Email: Password:
  • 6:57am
Menu
  • Forums
  • Trades
  • News
  • Calendar
  • Market
  • Brokers
  • Login
  • Join
  • 6:57am
Sister Sites
  • Metals Mine
  • Energy EXCH
  • Crypto Craft

Options

Bookmark Thread

First Page First Unread Last Page Last Post

Print Thread

Similar Threads

PTZ Based on Volume Spread Analysis and Harmonic Patterns 1,608 replies

Harmonic trading-harmonic patterns 518 replies

Harmonic patterns with supply and demand 1 reply

Harmonic Patterns and Volume 2 replies

GBPUSD GBPJPY Harmonic patterns and confluence of indicators 12 replies

  • Interactive Trading
  • /
  • Reply to Thread
  • Subscribe
  • 1,278
Attachments: Harmonic and Classic Patterns
Exit Attachments

Harmonic and Classic Patterns

  • Last Post
  •  
  • Page 1 23456 114
  • Page 1 2 114
  •  
  • Post #1
  • Quote
  • First Post: Edited Nov 9, 2010 9:57am Apr 29, 2009 12:59pm | Edited Nov 9, 2010 9:57am
  •  SwellTrader
  • | Joined Apr 2009 | Status: d-trader | 23 Posts
Hi all,
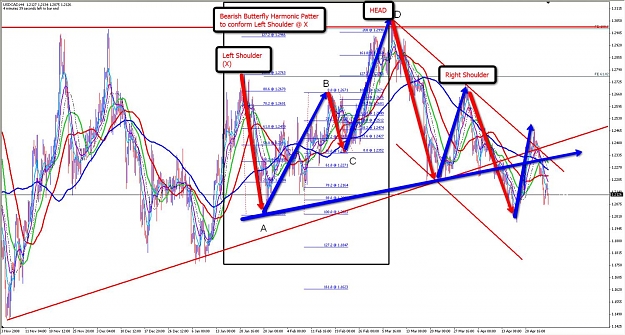
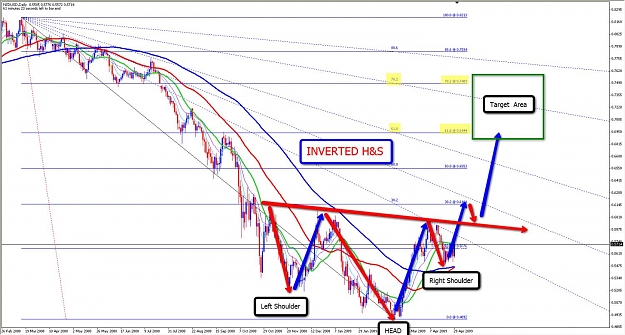
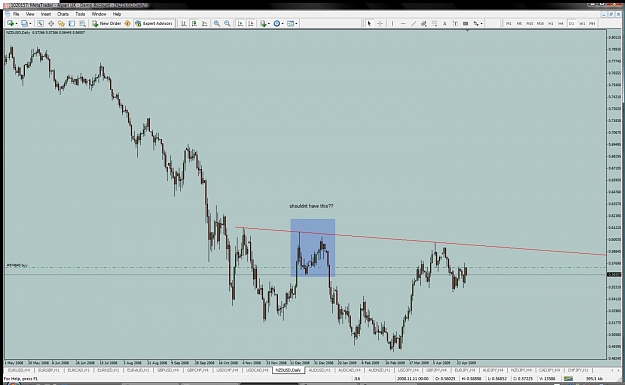
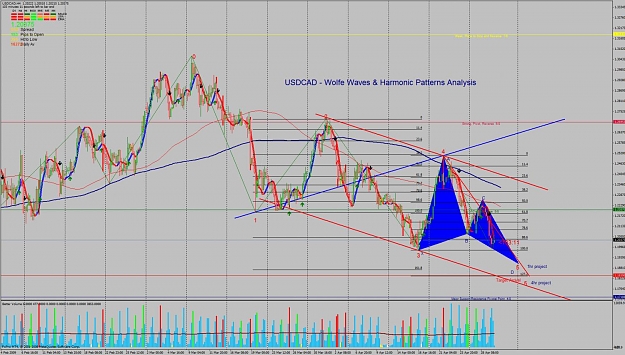
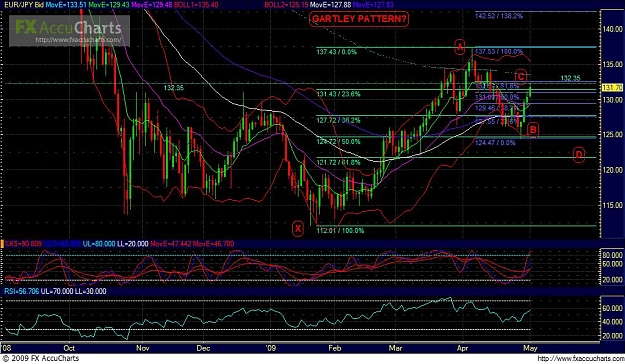
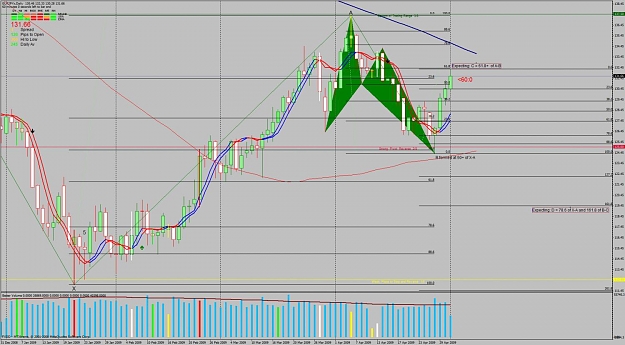
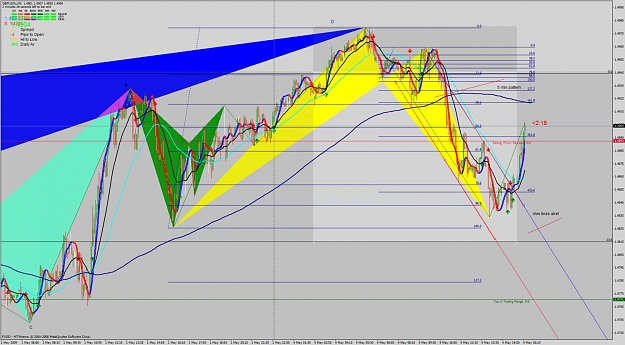
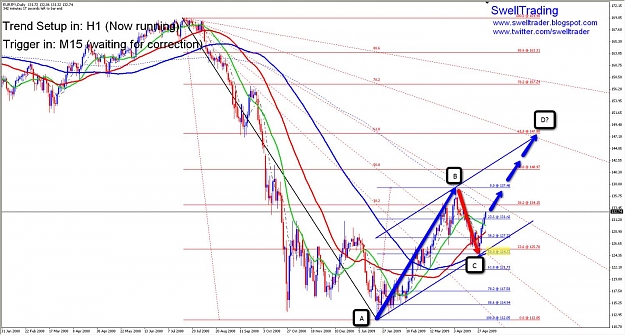
This thread is created to show Harmonic Patterns. I will be identifying Gartley, Butterfly, ABCD patterns as well as the more common Head and Shoulders, Triangles, Flags, etc...
A little info: My main method of trading is to follow my Wave Analysis in conjunction with identifying the popular Harmonic Patterns. Using wave analysis helps clarify and justify my trade entries and trade management. Combining this with my own entry trigger technique which I have developed with a trading colleague, has given my trading the much needed 'edge'.
I hope everyone can gain a little insight from my posts in this thread and please feel free to join in. Enjoy your stay!!

Gustavo.
  • Post #2
  • Quote
  • Edited at 4:44pm Apr 29, 2009 1:07pm | Edited at 4:44pm
  •  SwellTrader
  • | Joined Apr 2009 | Status: d-trader | 23 Posts
This is a possible Head & Shoulder pattern in H4 time frame.
Is important to note the previous Butterfly Harminoc Pattern which conforms Left Shoulder.

The Neckline breakout and retest is not so clear, but a new low below 1.1977 will confirm the bearish move.

As per the Patternīs theory, we`ll expect an aproximately 800 pips bearish move from the neckline to the south.
Attached Image (click to enlarge)
Click to Enlarge

Name: 2009-04-27_1155.jpg
Size: 184 KB
 
1
  • Post #3
  • Quote
  • Apr 29, 2009 1:19pm Apr 29, 2009 1:19pm
  •  fontu
  • Joined Mar 2008 | Status: Name real with real own way | 17,451 Posts
Quoting SwellTrader
Disliked
Hi all,
This thread is created to show Harmonic Patterns.
I`ll try to spot Gartleys and Butterflies, as well as Head and Shoulders, Triangles, Flags, etc.
Hope you enjoy it and to receive all your commentaries.

SwellTrader
Ignored
Thanks opening this tread & I have great interest recognizing patterns in real time trading . Hope many will post in real time & interact others to help good trading .
fontu
 
 
  • Post #4
  • Quote
  • Apr 29, 2009 4:41pm Apr 29, 2009 4:41pm
  •  SwellTrader
  • | Joined Apr 2009 | Status: d-trader | 23 Posts
This is a H&S in the daily Time frame.
Seems to be that right shoulder is done, so will wait for a breakout and retest of the Neckline.

The unfolding of the pattern will be helped by the bullish breakout of the 38.2 Fib Fan level.

First Target area is coinciding with 61.8% Fib Retracement of the whole bearish move from 0.8213, and second one could be at 78.2 level.
Attached Image (click to enlarge)
Click to Enlarge

Name: 2009-04-29_1500.jpg
Size: 158 KB
 
 
  • Post #5
  • Quote
  • Apr 29, 2009 5:16pm Apr 29, 2009 5:16pm
  •  [email protected]
  • Joined Feb 2008 | Status: sucker for punishment | 2,444 Posts
hi mate, i dont believe that is a legit h+s..??
cheers jon
Attached Image (click to enlarge)
Click to Enlarge

Name: daily.jpg
Size: 110 KB
PATIENCE... DISCIPLINE
 
 
  • Post #6
  • Quote
  • Apr 29, 2009 5:28pm Apr 29, 2009 5:28pm
  •  SwellTrader
  • | Joined Apr 2009 | Status: d-trader | 23 Posts
Quoting [email protected]
Disliked
hi mate, i dont believe that is a legit h+s..??
cheers jon
Ignored
Hi Jon,

Thanks for ur reply.
I think that the double top u remarked donīt invalidate the pattern.
Anyway, we have to wait for breakout and retest of the neckline for pattern confirmation.


  • Post #7
  • Quote
  • Apr 29, 2009 7:39pm Apr 29, 2009 7:39pm
  •  bingchi6
  • | Joined Nov 2006 | Status: One Swing @ a Time | 60 Posts
Quoting SwellTrader
Disliked
This is a possible Head & Shoulder pattern in H4 time frame.
Is important to note the previous Butterfly Harminoc Pattern which conforms Left Shoulder.

The Neckline breakout and retest is not so clear, but a new low below 1.1977 will confirm the bearish move.

As per the Patternīs theory, we`ll expect an aproximately 800 pips bearish move from the neckline to the south.
Ignored
Congrats open this thread. Hope everyone will enjoy and shared your view together.

As per usdcad i have combined together with wolfe waves count and harmonic patterns. These two are unfolding as price is still in down trend and will meet together in sometimes in near futures.

Cheers,
bc
Attached Image (click to enlarge)
Click to Enlarge

Name: usdcadww-harmonic.jpg
Size: 174 KB
 
1
  • Post #8
  • Quote
  • Apr 29, 2009 8:57pm Apr 29, 2009 8:57pm
  •  winningfx
  • | Joined Mar 2009 | Status: keep it simple stupid | 423 Posts
this definitely has a place in every1s trading. keep up the good work.
 
 
  • Post #9
  • Quote
  • Apr 30, 2009 7:17am Apr 30, 2009 7:17am
  •  SwellTrader
  • | Joined Apr 2009 | Status: d-trader | 23 Posts
Quoting bingchi6
Disliked
Congrats open this thread. Hope everyone will enjoy and shared your view together.

As per usdcad i have combined together with wolfe waves count and harmonic patterns. These two are unfolding as price is still in down trend and will meet together in sometimes in near futures.

Cheers,
bc
Ignored
Hey J! nice to see u here!

Thanks for the comment & post.
See that if the WW u show unfolds enterely, the H&S will be still valid since points 1 to 4 line coincides near with H&S`s neckline.


  • Post #10
  • Quote
  • May 1, 2009 5:11am May 1, 2009 5:11am
  •  errich fx
  • | Commercial Member | Joined Mar 2009 | 778 Posts
I like Gartley Patterns, thanks for the thread

__________________________________________________________

Learn Gartley Patterns
 
 
  • Post #11
  • Quote
  • May 2, 2009 3:29pm May 2, 2009 3:29pm
  •  [email protected]
  • Joined Feb 2008 | Status: sucker for punishment | 2,444 Posts
hi guys, the gartey patterns are something iv not researched, was wanting to know how reliable they are??has anyone been trading these patterns a while who could post some ave. stats??
cheers
jon
PATIENCE... DISCIPLINE
 
 
  • Post #12
  • Quote
  • May 2, 2009 4:26pm May 2, 2009 4:26pm
  •  StarChild
  • | Joined Sep 2008 | Status: Member | 202 Posts
Quoting [email protected]
Disliked
hi guys, the gartey patterns are something iv not researched, was wanting to know how reliable they are??has anyone been trading these patterns a while who could post some ave. stats??
cheers
jon
Ignored
I am looking also for some confirmation on gartly fib..posted a daily euro/jap chart..looks like pattern??? But I am knew to this fib pattern. Any senior members input would be welcome!
 
 
  • Post #13
  • Quote
  • May 2, 2009 4:29pm May 2, 2009 4:29pm
  •  StarChild
  • | Joined Sep 2008 | Status: Member | 202 Posts
Quoting errich fx
Disliked
I like Gartley Patterns, thanks for the thread

__________________________________________________________

Learn Gartley Patterns
Ignored
thanks for the site...I would appreciate any opinion on this euro/jpy daily chart..is it a gartly setup?
Attached Image (click to enlarge)
Click to Enlarge

Name: Chart132.JPG
Size: 143 KB
 
 
  • Post #14
  • Quote
  • May 2, 2009 11:40pm May 2, 2009 11:40pm
  •  alyehoud
  • | Joined Feb 2009 | Status: Member | 78 Posts
This thread has epic potential. Keep it up!
 
 
  • Post #15
  • Quote
  • May 3, 2009 12:21am May 3, 2009 12:21am
  •  cheagil
  • | Joined Jul 2007 | Status: use your head man!!!! | 215 Posts
this is the thread i have been waiting for.

hope the pattern formation is not limited to h&s.

bravo swelltrader.
 
 
  • Post #16
  • Quote
  • May 3, 2009 5:31am May 3, 2009 5:31am
  •  fxpip8
  • | Joined Feb 2009 | Status: Member | 73 Posts
Hi

Good thread, ST!

I am in fact acquiring the Harmonic method. This link is helpful . . . http://www.harmonictrader.com/

Hope to familiarize the AB=CD pattern first as well as Fibo retracements on primary numbers. Hope to see good examples.

Gartley + Butterfly are advanced to me but I enjoy reading the posts.

Hopefully someone can show the 3-Drives and Channels (0.618 & 1.270).

Let's keep up this thread.

fxpip8
 
 
  • Post #17
  • Quote
  • May 3, 2009 3:09pm May 3, 2009 3:09pm
  •  bingchi6
  • | Joined Nov 2006 | Status: One Swing @ a Time | 60 Posts
Quoting StarChild
Disliked
thanks for the site...I would appreciate any opinion on this euro/jpy daily chart..is it a gartly setup?
Ignored
Your projecting this bullish gartley patterns quite possible happens. We had the first retracement "B" formed at the fib 50 level of X-A. As of now we need to wait for price to find resistance at a specific level to form C and once it did we could anticapted the wave CD.

Remember this is a big (daily) patterns. From here price could form many small bulish/bearish patterns in between and hopefully that price will come down to the level we expecting.

Good luck,

bc
Attached Image (click to enlarge)
Click to Enlarge

Name: ejbullishgartley.jpg
Size: 143 KB
 
 
  • Post #18
  • Quote
  • May 3, 2009 3:34pm May 3, 2009 3:34pm
  •  StarChild
  • | Joined Sep 2008 | Status: Member | 202 Posts
Quoting bingchi6
Disliked
Your projecting this bullish gartley patterns quite possible happens. We had the first retracement "B" formed at the fib 50 level of X-A. As of now we need to wait for price to find resistance at a specific level to form C and once it did we could anticapted the wave CD.

Remember this is a big (daily) patterns. From here price could form many small bulish/bearish patterns in between and hopefully that price will come down to the level we expecting.

Good luck,

bc
Ignored
Thank you for you comments...Do you recomend a smaller time frame to go by?
 
 
  • Post #19
  • Quote
  • May 4, 2009 9:50am May 4, 2009 9:50am
  •  bingchi6
  • | Joined Nov 2006 | Status: One Swing @ a Time | 60 Posts
Here is 5 min chart bullish crab pattern of cable.
Attached Image (click to enlarge)
Click to Enlarge

Name: cable5min.jpg
Size: 147 KB
 
 
  • Post #20
  • Quote
  • May 4, 2009 12:10pm May 4, 2009 12:10pm
  •  SwellTrader
  • | Joined Apr 2009 | Status: d-trader | 23 Posts
Quoting StarChild
Disliked
thanks for the site...I would appreciate any opinion on this euro/jpy daily chart..is it a gartly setup?
Ignored
Hi Starchild,

What i trhink is that price is, for now, unfolding a AB=CD pattern, which have its crtitical moment at "B" point @ 137.40.
If price fail to breakout that point bullish, then we will begin to think in a possible bearish Gartley as u states.

For now, my bias is bullsih, looking for "C" point @ 61.8 FIBRET + 78.2 FIFAN "Fib Zone", @ aproximately 147.80 level.

Lets see what happens.

Swelltrader,
Attached Image (click to enlarge)
Click to Enlarge

Name: 2009-05-04_1017.jpg
Size: 163 KB
 
1
  • Interactive Trading
  • /
  • Harmonic and Classic Patterns
  • Reply to Thread
    • Page 1 23456 114
    • Page 1 2 114
0 traders viewing now
  • More
Top of Page
Forex Factory Blog Updated: Alerting All Members
  • Facebook
  • Twitter
About FF
  • Mission
  • Products
  • User Guide
  • Media Kit
  • Blog
  • Contact
FF Products
  • Forums
  • Trades
  • Calendar
  • News
  • Market
  • Brokers
  • Trade Explorer
FF Website
  • Homepage
  • Search
  • Members
  • Report a Bug
Follow FF
  • Facebook
  • Twitter

FF Sister Sites:

  • Metals Mine
  • Energy EXCH
  • Crypto Craft

Forex Factory® is a brand of Fair Economy, Inc.

Terms of Service / ©2022