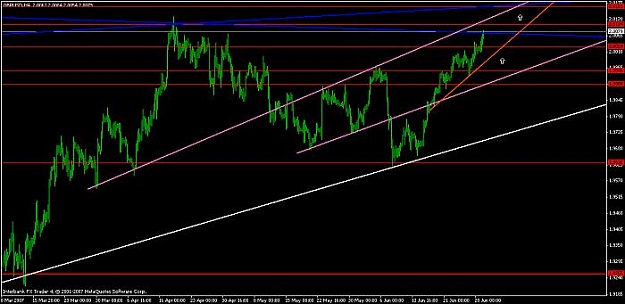
ok i might be going over board with trend lines but here is picture based strictly on trendlines on 4 hour chart, the 2 blue lines are major trend lines from month and weekly chart. hey i am learning here so please correct me if i am missing anything obvious.
Right now price at 2.0079.
maybe a retrace down to 2.0029(or somewhere in that region)lower arrow where inner top from april and current TL intersect.
then move back up to 2.0104 or( or somewhere in that region)
and eventually to 2.0165.upper arrow , where the blue and white TL intersect
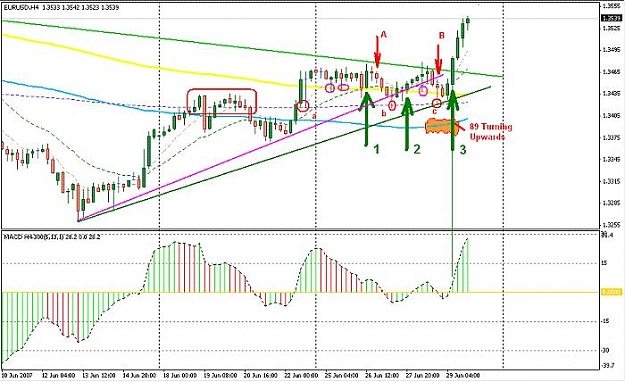
We have to keep in mind the MA , macd and news as well. but since we are in an uptrend this is what i see.
all comments welcome.
Right now price at 2.0079.
maybe a retrace down to 2.0029(or somewhere in that region)lower arrow where inner top from april and current TL intersect.
then move back up to 2.0104 or( or somewhere in that region)
and eventually to 2.0165.upper arrow , where the blue and white TL intersect
We have to keep in mind the MA , macd and news as well. but since we are in an uptrend this is what i see.
all comments welcome.
Attached Image (click to enlarge)
TRADE WHAT YOU SEE... FOCUS ON SUCCESS