Hi All,
I wonder how many people out there are still trading FSP and ONS?
I am hanging on there and continually looking for ways to try and improve them.
I trade ONS with a relatively tight volatility-based stop which, of course, has a lower percentage of winners but does better overall (according to my backtesting). Annoyingly I transferred some balance to an Oanda sub-account causing one of the orders to not be filled due to insufficient margin. Even though the overall risk is lower, the smaller stop causes much bigger positions to be taken... Unfortunately a losing trade was taken but not the winning USDJPY trade on the 16th July. A learning experience...
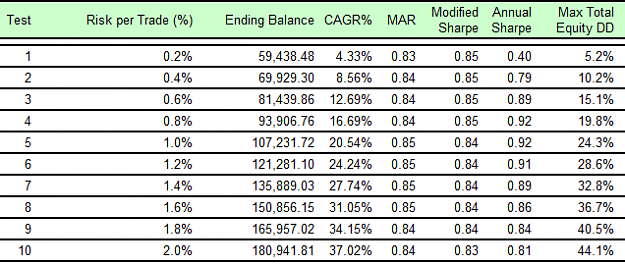
Anyway, onto the subject of my post. I have been playing around with reducing the position size for FSP based on the distance from the open to the buy/sell price compared to the 6 week average. This seems to improve the results considerably. I attach the results of my backtests reducing the percentage to values between 0% and 2% with 2% being a fullsize position.
The rule is if the 6 week average divided by the current distance is less that 1.25 then use the reduced position size. In other words, if the current week has a distance to entry that is a bit less than average then use full size.
Using a "reduced" position size of 0% gives the best risk-adjusted results but could miss a really good move.
The logic seems reasonable though - if you have a large move required to enter a position then, i) more of the move will be exhausted moving to the point of entry and ii) the position size will be smaller.
The change seems to eliminate a worthwhile number of whipsaw moves.
I've tested on all my hourly data from difference sources and it consistently improves the results, which is encouraging. The results attached are using hourly data from FXCM from 2005 onwards (GBPJPY is more recent).
Has anyone had similar experiences or have any thoughts?
Regards,
Timek
To clarify the meaning of the columns: CAGR% = annual percentage return, MAR = CAGR% divided by max equity drawdown and Max TE = Max equity drawdown


