

TP & SL Tool: Risk Reward Ratio Calculator RRR MT5 | Prop Firm Protector: Trade Assist Prop Firm Plus TF Expert MT5 | Money Management + DrawDown Protector: Trade Panel Prop Firm Drawdawn Limiter Pro MT5 |Get a free Expert Advisor license via Telegram and WhatsApp
What Are Classic Chart Patterns?
Classic chart patterns are repetitive technical formations that appear across various financial markets. They are primarily used to:
- Forecast future price directions
- Identify potential entry and exit points
- Determine stop-loss levels
- Confirm market trends using structural highs and lows
These patterns remain relevant due to their:
- Simplicity in recognition
- Compatibility with other technical tools (indicators, volume, candlestick analysis)
- Versatility across multiple asset classes and timeframes
Categories of Classic Patterns
Classic chart patterns fall into two primary categories:
- Reversal Patterns: Indicate a potential change in trend direction
- Continuation Patterns: Suggest the trend is likely to resume after a temporary correction
Reversal Patterns
Reversal patterns signal the exhaustion of the current trend and a potential reversal in price movement.
Head and Shoulders Pattern
- This pattern consists of a central peak (head) flanked by two smaller peaks (shoulders)
- It signals a potential reversal following a strong trend
- Common in H1, H4, and Daily timeframes
- Appears in both uptrends and downtrends
Double Top & Double Bottom
- Double Top: Two consecutive peaks near a resistance level indicate a bearish reversal
- Double Bottom: Two troughs at a support level suggest a bullish reversal
- Frequently observed in M30, H1, and H4 timeframes
Triple Top & Triple Bottom
- Triple Top: Price fails to break resistance after three attempts, indicating a likely downtrend
- Triple Bottom: Price rebounds off support three times, pointing to an uptrend
- Commonly identified in H4, Daily, and Weekly charts
Rounding Bottom & Rounding Top
- Rounding Bottom: A gradual shift from bearish to bullish sentiment, forming a bowl shape
- Rounding Top: A slow reversal from bullish to bearish, forming an arc
- Typically occurs in long-term charts such as Daily and Weekly timeframes
Continuation Patterns
Continuation patterns suggest that the price will continue moving in the direction of the prevailing trend after a brief pause or correction.
Flag Pattern
- Formed after a strong price movement (flagpole)
- Consists of a small channel sloping against the main trend
- Breakout usually occurs in the direction of the previous trend
- Ideal for short to medium-term trading (M5, M15, M30, H1)
Symmetrical Triangle
- Characterized by converging trendlines during price consolidation
- Typically resolves with a breakout in the direction of the existing trend
- Suitable for medium-term trading across various timeframes
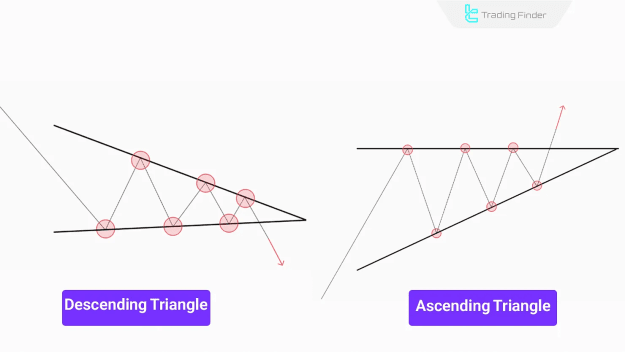
Ascending & Descending Triangles
- Ascending Triangle: Horizontal resistance and rising lows, often followed by a bullish breakout
- Descending Triangle: Horizontal support with falling highs, suggesting a bearish continuation
Wedge Patterns
- Rising Wedge: Sloping upward, typically ending in a bearish breakout
- Falling Wedge: Sloping downward, generally followed by a bullish breakout
- Seen in high-momentum trend phases across multiple timeframes
Rectangle Pattern
- Represents sideways price action between support and resistance levels
- A breakout above or below the range confirms trend continuation
- Visible in various timeframes, depending on market conditions
Advantages and Disadvantages of Classic Patterns
Advantages:
- Easy visual identification
- Applicable across all financial markets
- Can be integrated with volume and indicator-based analysis
Disadvantages:
- Risk of false breakouts
- Requires confirmation for reliability
- Signals may form with delay
Enhancing Trend Identification Using Classic Patterns
Relying solely on pattern recognition is insufficient. Combining pattern analysis with other technical tools can improve decision-making accuracy.
- Pattern Shape Analysis: Study the structure of price highs and lows
- Candlestick Behavior: Identify buying or selling pressure
- Volume Confirmation: Increased volume during breakout enhances reliability
- Indicator Support: Use of RSI, MACD, and Moving Averages for confirmation
- Multiple Timeframe Analysis: Ensures consistency across short and long-term charts
Combining Classic Patterns with Technical Indicators
To improve the effectiveness of classic patterns, traders often pair them with widely-used indicators.
Using RSI for Signal Confirmation
- RSI helps determine overbought or oversold conditions
- For example, a Double Bottom forming while RSI is oversold increases the probability of an upward reversal
Integrating MACD with Chart Patterns
- MACD helps confirm trend direction and momentum
- A bearish Head and Shoulders coupled with a MACD bearish crossover strengthens the likelihood of price decline
Conclusion
Classic chart patterns—divided into reversal and continuation types—remain essential tools for technical analysis. Patterns such as the Head and Shoulders, Double Tops and Bottoms, Flags, Triangles, and Wedges provide valuable insights into market behavior.
Combining these patterns with volume analysis, candlestick structure, and momentum indicators like RSI and MACD enhances their predictive power and reduces the risk of false signals in dynamic financial markets.