thesis: a statement or theory that is put forward as a premise to be maintained or proved
Day1 count starts when a breakout of a weekly high or low happens and it fails. FGD/FRD come out of a failed breakout of the weekly high or low. The day the breakout fails is Day1. Often confirmed the next day.
High Bull Major Resistance HBMR Highest Bull candle on day HBMR-D on week HBMR
Low Bear Major Support LBMS Lowest Bear candle on day LBMS-D on week LBMS
The most important point of the day/week is the failed breakout.
FRD closes below the open and there will be a peak formation, in most cases, above the close of the day.
He looks for what he calls "break in structure on the inside". This is where you have a minor high/low inside the day/week high/low.
A failed breakout at the HOW/LOW will often lead into a 3 day setup.
If Monday is the OR - opening range - for the week a breakout of this H/L range is (a) a false break, (b) a trend "explosion", (C) or it could be the range for the week (seldom).
If Monday is a Day1 breakout of a previous day's H/L, and is "inside" the previous weeks range do not countertrend this move.
By the time Monday and Tuesday have traded, the high and low for the week will be in place. In most cases, one of these levels H or L will tend to hold for the rest of the week.
PnD/DnP session entry. Want a 25 to 50 pip move in the first 30 to 45 minutes. That is the stop hunt.
#1 thing to remember: "Is there a false break anywhere? Is there a failed breakout?"
Heading into a new week, typically in most cases, the peak formation failure will often already have happened near the end of the week. Day1 will often alredy have occured by Monday. That is for the 3-day count. Weekly template Monday is always Day1.
Some raw notes thesis: a statement or theory that is put forward as a premise to be maintained or proved Day1 count starts when a breakout of a weekly high or low happens and it fails. FGD/FRD come out of a failed breakout of the weekly high or low. The day the breakout fails is Day1. Often confirmed the next day. High Bull Major Resistance HBMR Highest Bull candle on day HBMR-D on week HBMR Low Bear Major Support LBMS Lowest Bear candle on day LBMS-D on week LBMS The most important point of the day/week is the failed breakout. FRD closes below...
Joined Mar 2004
|
Status: Senior Member
|1,584 Posts
Was going over my notes as well... will try to make a comparison.
My issue is... ' what does that mean ? ' . For example.... when there is a Green Day and then a Red Day ...what does that mean for the trade set up ?
I need to set up a series of ..... If - Then .... statements that I can quickly and easily reference . I want one of those 3 day weekends.
Was going over my notes as well... will try to make a comparison. My issue is... ' what does that mean ? ' . For example.... when there is a Green Day and then a Red Day ...what does that mean for the trade set up ? I need to set up a series of ..... If - Then .... statements that I can quickly and easily reference . I want one of those 3 day weekends.
Ignored
According to SB, the last breakout takes priority. From there you see if PA plays out as it could. There are a number of possibilities that narrow rapidly as time goes on.
The overall method is simple. Its execution can be problematic at times.
The 3 day cycle is interesting. But I do not want to spend too much time completely figuring it out (although I am very close and will let it come to me). There is also the weekly template which offers many possibilities. I think that may be the one to focus on more and the other will show up.
Beyond that are the HOD/LOD, HOW/LOW, HOS/LOS. The possibilities are seemingly infinite.
{quote} According to SB, the last breakout takes priority. From there you see if PA plays out as it could. There are a number of possibilities that narrow rapidly as time goes on. The overall method is simple. Its execution can be problematic at times. The 3 day cycle is interesting. But I do not want to spend too much time completely figuring it out (although I am very close and will let it come to me). There is also the weekly template which offers many possibilities. I think that may be the one to focus on more and the other will show up. Beyond...
Ignored
What you describe is exactly why I decided to focus on certain levels by putting them on my chart.
OR IB W H/L M H/L D H/L from the prior day . I also put on the W opening price.
Then look for price action near/at these levels. I look back at the flow of price but don't 'calculate' RD GD or ID.
{quote} What you describe is exactly why I decided to focus on certain levels by putting them on my chart. OR IB W H/L M H/L D H/L from the prior day . I also put on the W opening price. Then look for price action near/at these levels. I look back at the flow of price but don't 'calculate' RD GD or ID.
Ignored
It is confusing at times. But it is getting clearer. I think if you focus on the H/L/O and are aware of price flow from day to day it is workable.
Some raw notes thesis: a statement or theory that is put forward as a premise to be maintained or proved Day1 count starts when a breakout of a weekly high or low happens and it fails. FGD/FRD come out of a failed breakout of the weekly high or low. The day the breakout fails is Day1. Often confirmed the next day. High Bull Major Resistance HBMR Highest Bull candle on day HBMR-D on week HBMR Low Bear Major Support LBMS Lowest Bear candle on day LBMS-D on week LBMS The most important point of the day/week is the failed breakout. FRD closes below...
Ignored
Raw notes 2
2//
3 levels of rise/drop from H/L for potential entry area.
Burke uses the M15 until price reaches one of his strike areas. He will then drop to M1/M5.
The most recent breakout that fails is the most important one and that is where the day count starts.
LHF = Low Hanging Fruit This is a "trend" continuation entry. Made on a pullback from the main direction.
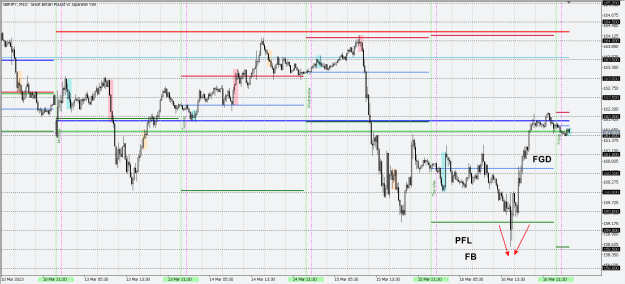
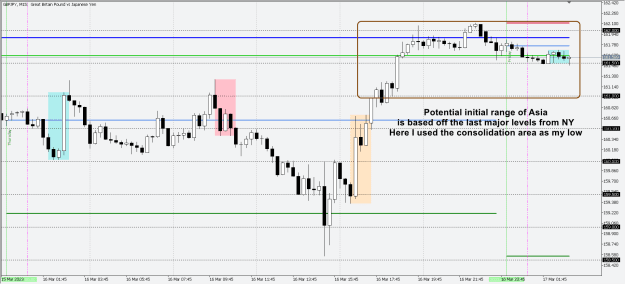
Last swing low and last swing high make up the EOD consolidation and the initial Asia range.
Day0 trade. PFH and PFL trade inside, coil the market for a short squeeze.
3Day setup is exactly that.
The previous day gives you the information to trade today.
Do not counter trend trade if there is no break in structure.
Don't focus on pips. Focus on the quality of the setup.
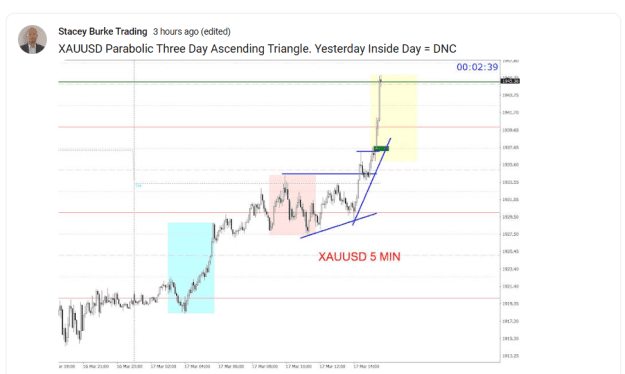
PFH/PFL consolidation is the setup for a possible parabolic move.
The most important thing to understand with the day count is mastering the false breaks.
When you master the false break and know when people are trapped in the market, you know where the money is.
To reiterate, the count starts when there is a False Break at the LOW or HIGH of the WEEK.
Stick to the outside of the chart.
Time of day is critical.
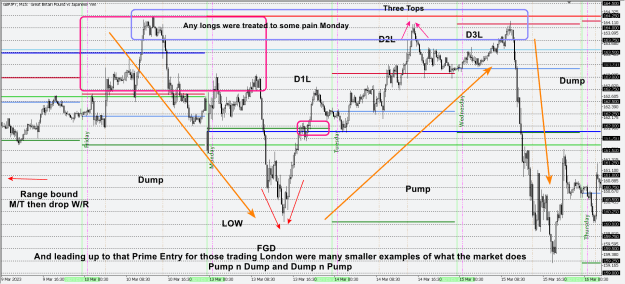
Pump n' Dump and Dump n' Pump
Understand the Psychology of Who is Trapped and Where is the Money.
The discipline is: Don't do anything stupid. Don't keep trading (after your trade session??or after max loss for day??). Learn how to scale your trades up in size. Be patient. Just get off the screen (when your day is done, time, daily profit).
In live time it is all about coming to the screen and being prepared go through each chart, taking a few minutes and being patient enough to look at the big picture, who is in the market, what are the two scenarios that can happen - is it going to go up, is it going to go down, or is it a garbage chart and you move on to the next one.
I have been doing the deep dive into SBurke's method of trading market structure. The "Day" count comes up all the time. What most do not seem to grasp is that there are a few "Day" counts and this is where it gets confusing. It is why I stepped back from SB for a bit while I finished finalizing my entry/scalp system. I am very glad I have come back to finally have some understanding of this.
The main count is off the "Weekly Template". This is where Monday is Day1 and always Day1, Tuesday is Day2, Wednesday is Day3, and you guessed it, Thursday is Day4 and Friday is Day5. A main component of the Weekly Template is the PnD/DnP. These will set up Monday and Tuesday often with a Wednesday entry if there is a signal during a session. That is important. All entries are based on the session boxes. SB uses a 3 hour session window, often with the setup in the first hour via some type of ye olde fakey move.
Another 3 Day setup is the "trend" type moves consisting of 2 to 4 days of general or decisive movement in a directio.
And the last is the 3 Day count the initiates from a weekly H/L failed breakout.
(1) 3 Day setups off the Weekly Template
(2) FRD/FGD
(3) Day 3 Longs/Day 3 Shorts
(4) Short Squeeze potential parabolic
(5) First bounce major news
(6) Session HOD/LOD "scalps"
{quote} Raw notes 2 2// 3 levels of rise/drop from H/L for potential entry area. Burke uses the M15 until price reaches one of his strike areas. He will then drop to M1/M5. The most recent breakout that fails is the most important one and that is where the day count starts. LHF = Low Hanging Fruit This is a "trend" continuation entry. Made on a pullback from the main direction. Last swing low and last swing high make up the EOD consolidation and the initial Asia range. Day0 trade. PFH and PFL trade inside, coil the market for a short squeeze. 3Day...
Ignored
Notes 3
Trades from the inside are trend trades back to the extreme that the target is always the high and low, unless it's an inside day and in most of those cases you will not have a trade setup, it will be a narrow range, consolidating day.
FRD - First Red Day - you need 2 to 3 green (up) days in a row. You want to see a FRD form after a PFH - Peak Formation High.
The setup from a FRD could take 1 or 2 days. And it may not come at all. The FRD is the initial signal that a larger move may be ahead.
FGD - First Green Day - you need 2 to 3 red (down) days in a row. You want to see a FGD form after a PFL - Peak Formation Low.
The setup from a FGD could take 1 or 2 days. And it may not come at all. The FGD is the initial signal that a larger move may be ahead.
The Day count that some (including myself before) try to make fit is some sort of continuous 3 Day cycle when in reality you are looking for signals that start the process of 3 Day setups.