DislikedRH let me know what you think. I also have different tabs for each time frame. {image} {image}{image}{image}{image}Ignored
And maybe try this as a condition:
Properties
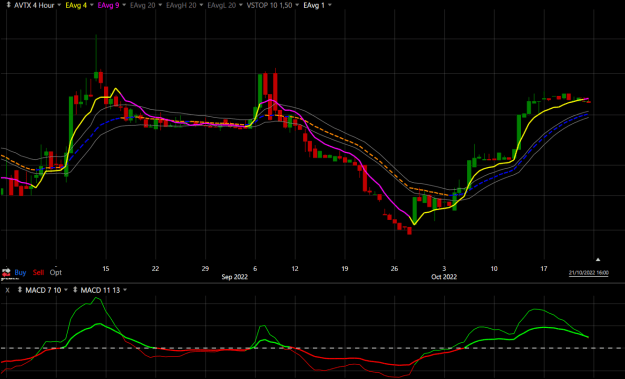
Name: 3 EMA > 8 EMA > 17 EMA > 30 SMA
(C > AVGC3) AND (AVGC3 > AVGC8) AND (AVGC8 > AVGC17) AND (AVGC17 > AVGC30)
Obviously you can change the lengths and types of ma's...it's the idea and how to do it that matters here.
Also...I have not tried it yet but see if you can get the Hulls in there, that could be interesting.
Always a Student, Never a Master - Emulate What Works