GU and NVO:
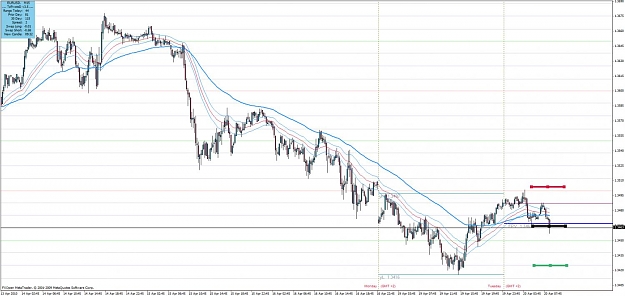
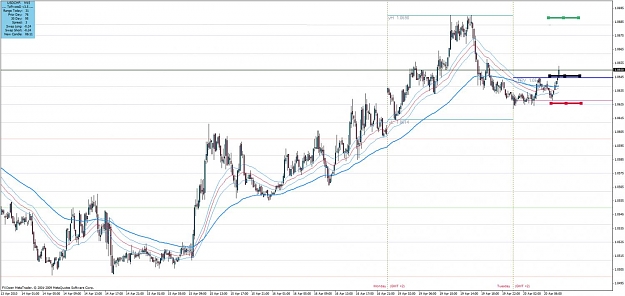
M5 chart NVO shows where trader activity was high, and the price range at the time. It is the price range that price has now been pulled back down to. So, one interpretation is that this is consolidating at a popular level for another leg up. Warning: Speculation!
I used a black chart here only to have the NVO study stand out.
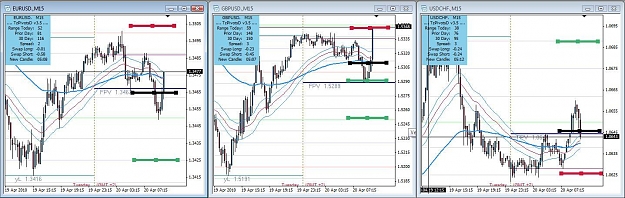
Attached Image (click to enlarge)