The Sonic R. System: Then and Now
Sonicers,
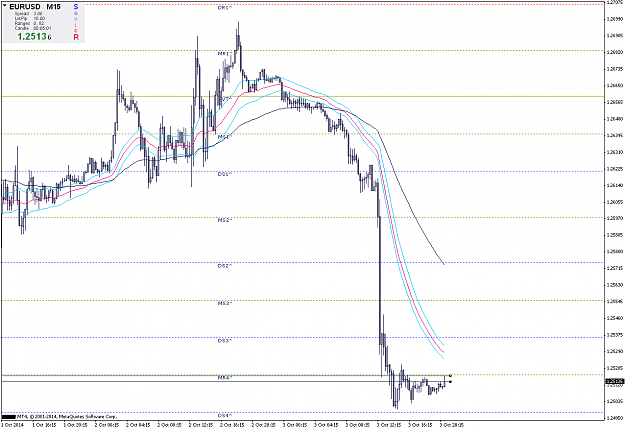
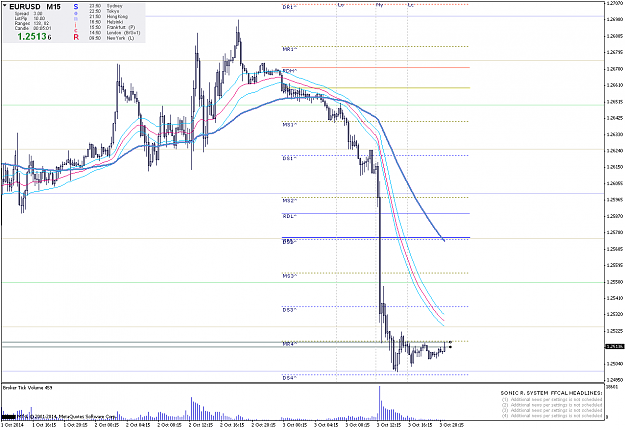
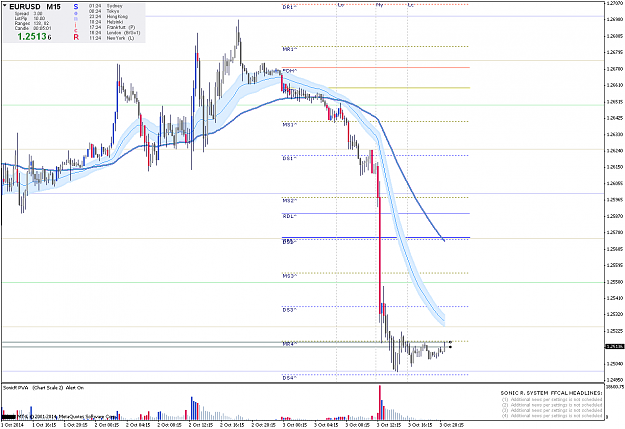
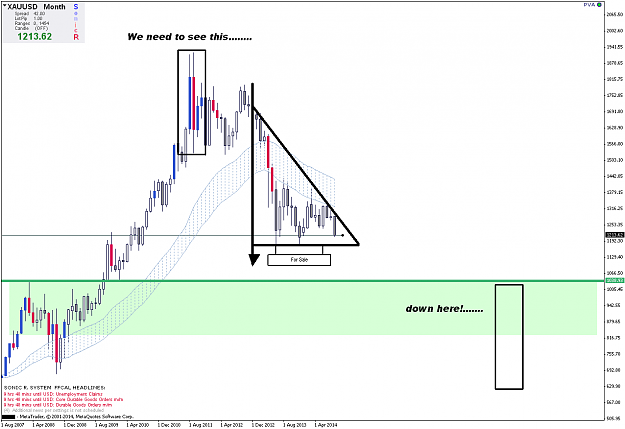
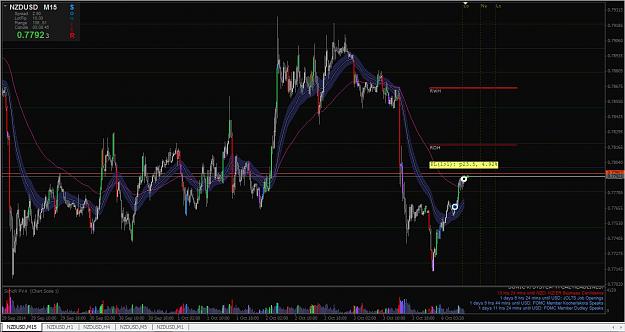
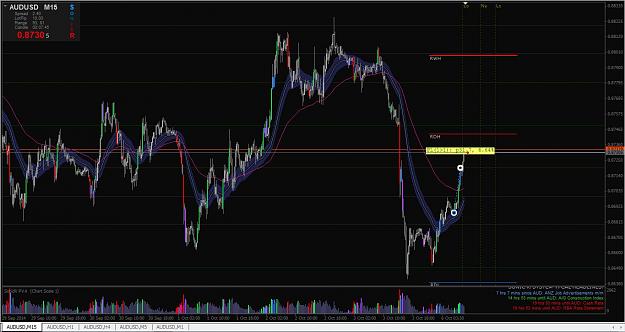
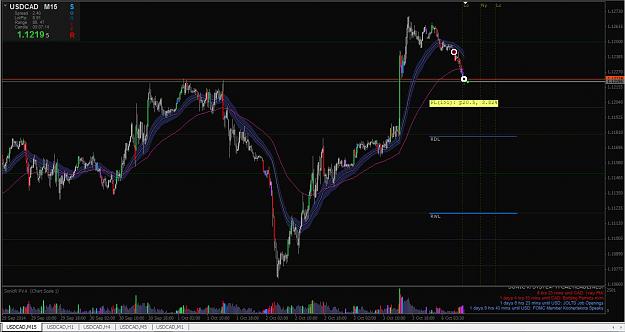
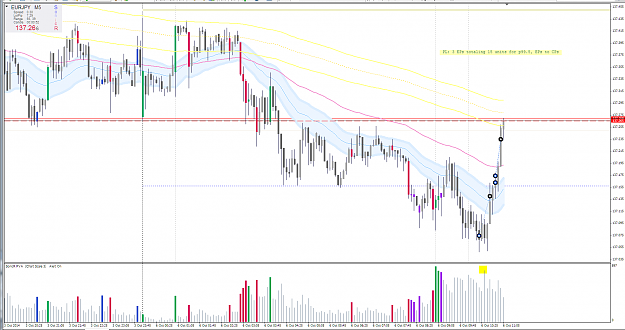
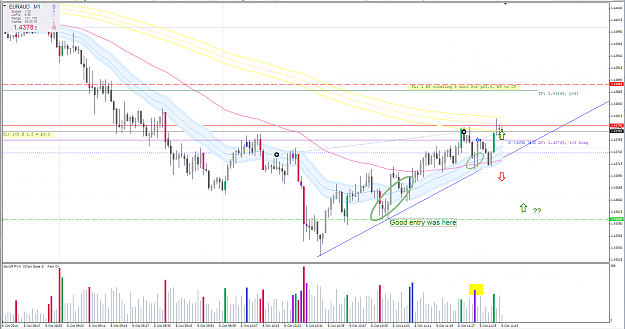
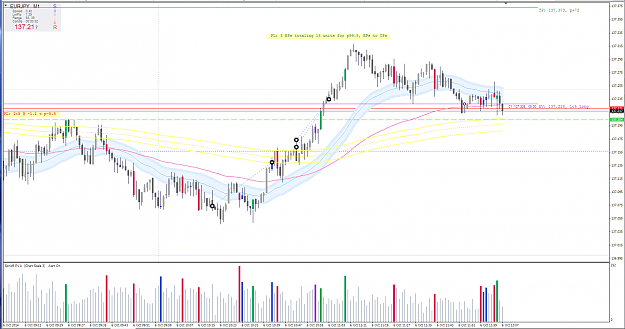
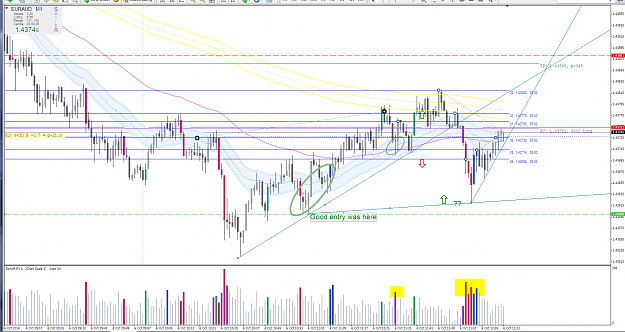
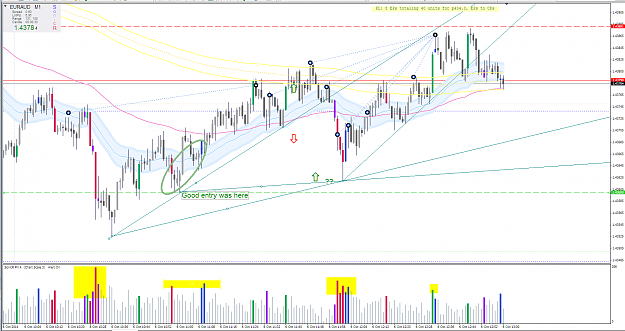
The first chart below is a facsimile of the early Sonic R. System template containing just the Dragon, Trend and daily pivots. The second chart is a facsimile of what this template has evolved into, containing additional helpful items such as the time zone Clock, FFCal Headlines, Day and Week range high/low marks, v-lines marking important transitions during the forex market trading day, and volume. As you can see, the template now provides a few additional visuals to help you with your trading analysis and decisions, but is fundamentally unchanged.
In the early days of this thread various chart sub-window indicators were tried. In order of appearance in various forms, they were: macd, stochastics, QQE, CCI, and then volume. Volume outlasted the others for the simple reason the others were all derivatives of price itself whereas volume is the only indicator that is not a derivative of price, and therefore not redundant and more valuable than all the other indicators when used properly.
There is a fundamental problem all traders face and which no amount of added indicators can solve, though traders constantly attempt to do so. They only succeed in thinking they have solved this problem and proceed to trade with a cluttered chart and false confidence. The problem is that market moves are either about the MMs obtaining liquidity to build a position, or about obtaining a profit on that position. The first results in choppiness, head fake moves and moves that do not follow thru, as the MMs manipulate prices to get traders to bring their money into the market and then steal it from them. The second results usually in the trending moves that push the positions the MMs have to greater profits. The problem for traders of "liquidity hunting" by the MMs is best dealt with by being patient with entries, holding off until you think a Head Fake or a Stop Hunt move has finished, and then look for your setup. Of course, the MMs sometimes engage in multiple attempts to try and catch traders that are more "knowing" of how the market really works. There really is no "ultimate" solution to this problem, and certainly the addition of indicators to a chart only makes things worse for the trader, who is now indicator dependent, has no concept of what is really going on in the market, and can no longer see PA clearly enough to know what is going on in the market!
The basic concept of the Sonic R. System is to use the Dragon (angle) as a measure of market "initial thrust" momentum, to use price waves as an indicator for direction, to use S/R to qualify the placement of the price waves, to use PA itself to qualify the composition of the price waves (smooth appearance vs ragged, due to the candles involved) and to use volume to gauge (if possible) if the MMs have been building mostly at high or low prices, or if they have aggressively pushed the price for profits, either at the start of or the end of a run. And, the recommendation to only consider setups that occur during the LS is to help assure there is maximum "thrust" momentum for the trade. It is important to understand this does not necessarily mean to take the first setup in the LS, because the US open MMs can, and do frequently reverse price - Stop Hunt or a Head Fake - before allowing the price to proceed in the anticipated direction, and because sometimes the early LS setup and beginning move is a Stop Hunt or a Head Fake, which is followed by the US open MMs running the price in the opposite direction!
There is not, nor will there ever be, a method of trading and use of indicators (from none to many) that resolves the fundamental problem all traders face, which is that the MMs control price and manipulate it to obtain liquidity to build positions and then to make a profit on them. They do this with manipulated price moves that can run totally contrary to "news" and to any "analysis" anyone might perform in an attempt to predict how price will move. This is the nature of the market. This is how the market works. Accept it, or leave it. If you choose to accept it and strive to be a more successful trader, the Sonic R. System is elegantly simple and effective.
 -tah
-tah
Sonicers,
The first chart below is a facsimile of the early Sonic R. System template containing just the Dragon, Trend and daily pivots. The second chart is a facsimile of what this template has evolved into, containing additional helpful items such as the time zone Clock, FFCal Headlines, Day and Week range high/low marks, v-lines marking important transitions during the forex market trading day, and volume. As you can see, the template now provides a few additional visuals to help you with your trading analysis and decisions, but is fundamentally unchanged.
In the early days of this thread various chart sub-window indicators were tried. In order of appearance in various forms, they were: macd, stochastics, QQE, CCI, and then volume. Volume outlasted the others for the simple reason the others were all derivatives of price itself whereas volume is the only indicator that is not a derivative of price, and therefore not redundant and more valuable than all the other indicators when used properly.
There is a fundamental problem all traders face and which no amount of added indicators can solve, though traders constantly attempt to do so. They only succeed in thinking they have solved this problem and proceed to trade with a cluttered chart and false confidence. The problem is that market moves are either about the MMs obtaining liquidity to build a position, or about obtaining a profit on that position. The first results in choppiness, head fake moves and moves that do not follow thru, as the MMs manipulate prices to get traders to bring their money into the market and then steal it from them. The second results usually in the trending moves that push the positions the MMs have to greater profits. The problem for traders of "liquidity hunting" by the MMs is best dealt with by being patient with entries, holding off until you think a Head Fake or a Stop Hunt move has finished, and then look for your setup. Of course, the MMs sometimes engage in multiple attempts to try and catch traders that are more "knowing" of how the market really works. There really is no "ultimate" solution to this problem, and certainly the addition of indicators to a chart only makes things worse for the trader, who is now indicator dependent, has no concept of what is really going on in the market, and can no longer see PA clearly enough to know what is going on in the market!
The basic concept of the Sonic R. System is to use the Dragon (angle) as a measure of market "initial thrust" momentum, to use price waves as an indicator for direction, to use S/R to qualify the placement of the price waves, to use PA itself to qualify the composition of the price waves (smooth appearance vs ragged, due to the candles involved) and to use volume to gauge (if possible) if the MMs have been building mostly at high or low prices, or if they have aggressively pushed the price for profits, either at the start of or the end of a run. And, the recommendation to only consider setups that occur during the LS is to help assure there is maximum "thrust" momentum for the trade. It is important to understand this does not necessarily mean to take the first setup in the LS, because the US open MMs can, and do frequently reverse price - Stop Hunt or a Head Fake - before allowing the price to proceed in the anticipated direction, and because sometimes the early LS setup and beginning move is a Stop Hunt or a Head Fake, which is followed by the US open MMs running the price in the opposite direction!
There is not, nor will there ever be, a method of trading and use of indicators (from none to many) that resolves the fundamental problem all traders face, which is that the MMs control price and manipulate it to obtain liquidity to build positions and then to make a profit on them. They do this with manipulated price moves that can run totally contrary to "news" and to any "analysis" anyone might perform in an attempt to predict how price will move. This is the nature of the market. This is how the market works. Accept it, or leave it. If you choose to accept it and strive to be a more successful trader, the Sonic R. System is elegantly simple and effective.
Attached Image(s) (click to enlarge)