DislikedHansma is the Supply and Demand expert here. You should be directing the question to him.
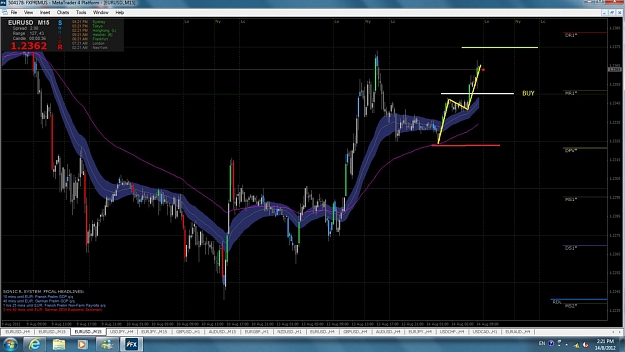
I'll tell you what I see, though. On the Daily chart PA has returned up to a S&R area, my "quesstimated" center being shown by the red line on my chart. Right at the highs, if you look closely at the candles, you will see two adjacent candles with long wicks. The first has the wick up. The second has the wick down. This order is not significant, but what is significant is the wide swing in price these two candles represent, possibly indicating the market...Ignored
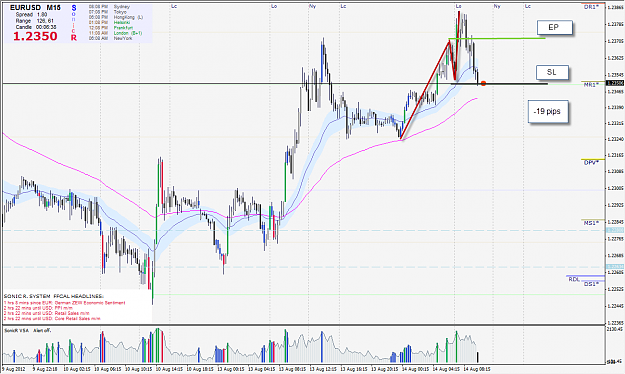
Wish you a successful short on EU....
I hope Hansma can comment on my chart.....
Best regards...