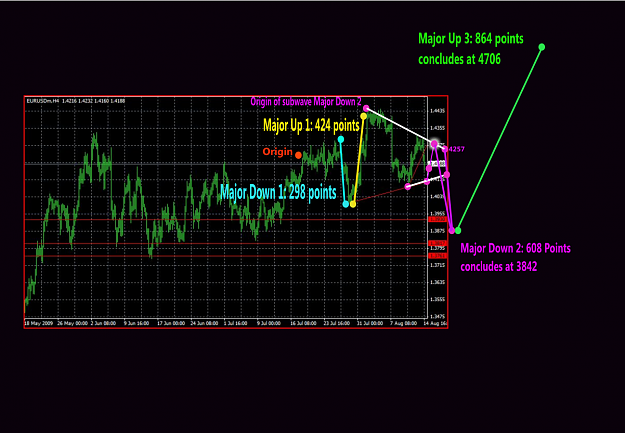
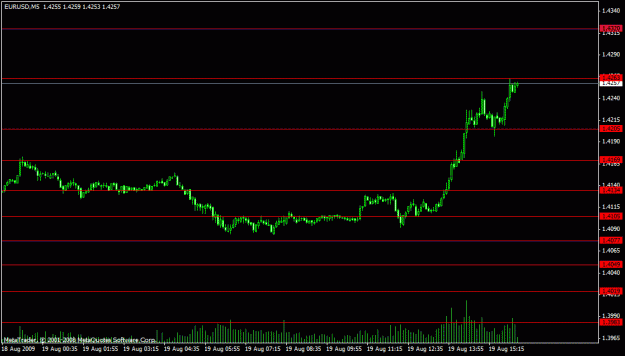
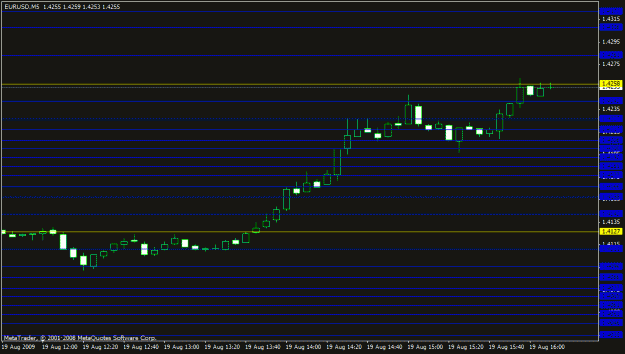
here is the red chart again.. as you can see its still working... the second chart is longer term taking from nov. of last year..i havent even finished it yet... you will see on it some yellow lines.. just above (yellow line) where we are currently at you will notice the blue lines spread apart. this means if we get there moves will be bigger...more pips in a move...
Attached Image(s) (click to enlarge)
those who can, do. those who cant, talk about those who can