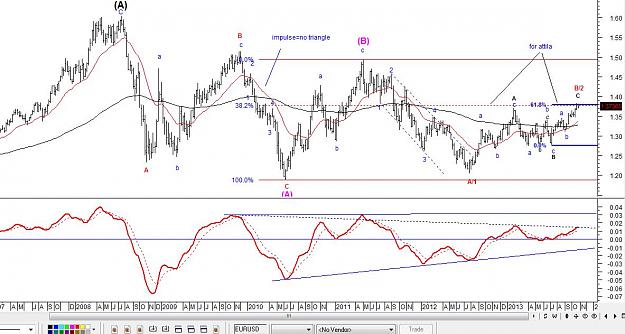
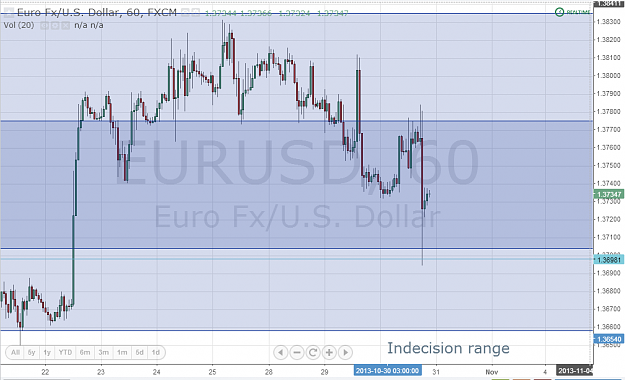
1.37050 was a requirement for the bullish trend to resume, i was not expecting it to hold - but it did ... Anyways, the problem before dropping it touched 1.37750 on the hourly chart which is 24th of October daily low. So on the 1H time frame it looks like its breaking down. ! So, i would say there is a conflict on various time frames to determine a direction. No wonder the daily is closing as a doji ! It could be a good indication we are going to range between 1.37750 - 1.37040 , with upside / downside protection for the range 1.38350 / 1.36560.
we will see
* Disclaimer: The blue lines are not Fibonacci numbers.
we will see
* Disclaimer: The blue lines are not Fibonacci numbers.
Attached Image (click to enlarge)
"It's the Margin, Stupid."