Yep, I did the same thing (google). I had heard of Jenkins, but had forgotten the Dresnok story. Just goes to show that JW may really be the great Father. Wiki says that Dresnok translated some of Jay's teachings.
Good night all. Good hanging with you tonight, but not a lot of action. Still wondering about 2991 as double top. Saw nothing in the past two hours to convince me otherwise, but pa is weak.
Good night all. Good hanging with you tonight, but not a lot of action. Still wondering about 2991 as double top. Saw nothing in the past two hours to convince me otherwise, but pa is weak.
|
Joined Feb 2009
|
Status: my oponion i have them all
|152 Posts
This is my call please tell me if its totally off.... Im expecting it to get up in to the 1.2820-1.2830's over night to retrace then become strong bearish and end up tomorrow in the mid upper 1.25XX anyone have reasons to back me up or shut me down id love to hear them..
This is my call please tell me if its totally off.... Im expecting it to get up in to the 1.2820-1.2830's over night to retrace then become strong bearish and end up tomorrow in the mid upper 1.25XX anyone have reasons to back me up or shut me down id love to hear them..
Ignored
How can anyone answer when all you did was provide numbers but no reasons?
|
Joined Feb 2009
|
Status: my oponion i have them all
|152 Posts
Sorry my reasons are the on the daily chart the bolinger bands converge near the 1.2830 my fib retracement 61 is right at that level as well on the 1 hour chart, my parabolic on the one hour is showing bullish but my rsi is already in overbought territory if any thing i think it will atleast hit 1.2770 at the 50 fib
Joined Aug 2008
|
Status: Self-proclaimed psychologist
|3,179 Posts
this question goes to the elliot wave experts again as im curious about that analysis at this time. note that i do not base my trading on this and am seeying another big bear flag on the hourly chart but will look for a break of the current range (1.2765 or so to the upside) and 1.2665 or so to the downside before i open any more positions (i will also use those levels to short or buy if they act as strong support/resistance..to be seen)
please tell me if this is accurate...could this be a formation of a wave 5 here or was this wave 4 that i post too long? or even has the small weekend gap screwed it all up anyways..haha...opinions?
Attached Image (click to enlarge)
Different opinions highly valued, ignorant to slander.
Sorry my reasons are the on the daily chart the bolinger bands converge near the 1.2830
Ignored
Curious about your BB settings... my standard BB's (20,2,2) have an Upper Band at 3130ish but my Daily also closes at 5pm. A few pips wouldn't matter, but 300 raises a question. No big deal, was just wondering.
Your daily close is either very different, or your BB's are set different. I don't use them on the Daily anymore myself but live by them on the lower TF's using custom settings.
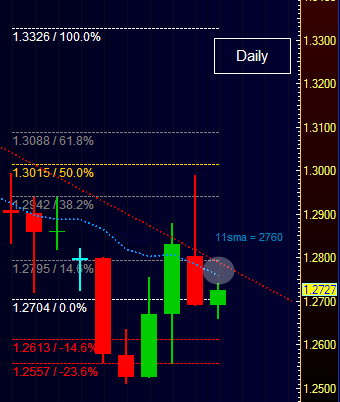
I do use the 11sma extensively on the Daily chart, the only one I really pay much attention to recently. Out of the last 38 daily candles, only 2 of them have manged an Open and Close above the 11sma which is currently at 2760 until tomorow at 5pm EST.
Regarding your upper target, I guess I could see the Fo/Lo session taking it up there to clear stops and pull in some more longs, before turning lower which is my current trade ((the lower part, not the climb up)). Nuck and gator and the other crazies that are Long will likely get some of my money if I'm wrong and FO/LO takes it up ,up, and away...
But no I don't think you're too far off base. Difference is I'm short from the mid 29's, and NOT looking to enter short at this levels. I'd be leery of doing that atm...
Actually, getting into any trade right before Frankie open is generally one of my no-no's. We'll see.
please tell me if this is accurate...could this be a formation of a wave 5 here or was this wave 4 that i post too long? or even has the small weekend gap screwed it all up anyways..haha...opinions?
Ignored
Wave 4 should not go much further than 38% fib retracement, 50% as a big maximum.
Looks like 2742 would have been a good place to go short and pick up some pips. My chart here, http://www.forexfactory.com/showpost...ostcount=68197, shows this as the 50% retrace and why taking the swing Hi/Lo is not always the best choice when plotting your fibs.
Wave 4 should not go much further than 38% fib retracement, 50% as a big maximum.
Ignored
so in other words its time for me to stick to what i know..gotta
so here it is...classic bear flag after a nice run down...now as well know by now..double tops and double bottoms are common these days..the first level of support is the area of the previous low around 1.2665. If we do not reach that level...I am currently looking for a break of 1.2765 to the upside. Current bias neutral...pa is pretty much in the middle of last weeks range and can go either way. Did i mention the bear flag broke down already? also note though that the triangle walls have expanded all day which is why a break of horizontal support/resistance is the best confirmation of future direction.
Attached Image (click to enlarge)
Different opinions highly valued, ignorant to slander.
Sorry my reasons are the on the daily chart the bolinger bands converge near the 1.2830 my fib retracement 61 is right at that level as well on the 1 hour chart, my parabolic on the one hour is showing bullish but my rsi is already in overbought territory if any thing i think it will atleast hit 1.2770 at the 50 fib
Ignored
Pull up a Daily Chart, put horizontal lines at the top and bottom of February 2nd bar (which was a lower low with price closing higher than the previous day's bar/candle H=1.2915 L=1.2704 C=1.2904). Now look at all the other bars from there until today. Price wants to get below 1.2704 and go down further. It is having trouble/resistance at 1.2704. Now pull up some lower time frames and watch the reactions at 1.2704 area, of course it can still goup to retest 1.2915, but it is more likely to go down.
Joined Aug 2008
|
Status: Self-proclaimed psychologist
|3,179 Posts
just pulled up a 5min chart for the first time in like 8 hours haha. it is evident we are trying to form an inverted h&s here (an ugly one at best haha) with shoulderline at 1.2695 and neckline at 1.2760. If that is the case and we break 1.2760 decisively ...that should lead to at least a 100pip run up (distance from tip of head to neckline) which puts us at my next significant resistance..1.2870
my bias judging current pa and market sentiment is slowly switching to bullish....not convinced yet though..comon break of 1.2760
only entry would be breakout and retest to confirm it has become support of course
Attached Image (click to enlarge)
Edit: shoulderline could also be at 1.2715 or so..debatable..not that it makes much difference though now
Different opinions highly valued, ignorant to slander.
Pull up a Daily Chart, put horizontal lines at the top and bottom of February 2nd bar (which was a lower low with price closing higher than the previous day's bar/candle H=1.2915 L=1.2704 C=1.2904). Now look at all the other bars from there until today. Price wants to get below 1.2704 and go down further. It is having trouble/resistance at 1.2704. Now pull up some lower time frames and watch the reactions at 1.2704 area, of course it can still goup to retest 1.2915, but it is more likely to go down.
Good Trading.
Ignored
Agree, yet to be at 1.2915 is fine for me for the day as it is 200pip. then where ever the market goes, "I'll will follow you"
Joined Aug 2008
|
Status: Self-proclaimed psychologist
|3,179 Posts
one final post for now (thank goodness right? haha)....i recommend all check the calendar for today...there is alot of news all throughout euro session and in the us session which may drive the markets
Different opinions highly valued, ignorant to slander.