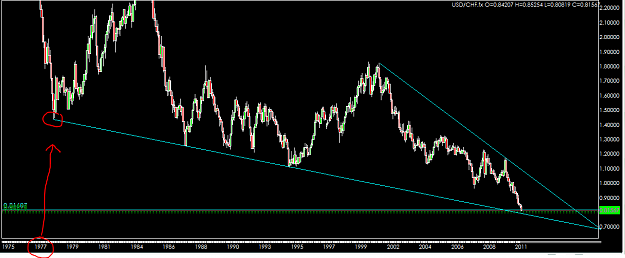
DislikedBecause of the data used itself, thats a bit too complicated to explain but you at the second picture you can see the horizontal distribution of observations. When you look at the bars printed, the crossover into deeper/higher level is the vertical distribution.Ignored
is your chart a normal distribution with a mean of 4125 and a standard deviation of whatever it is ?
I am saying the chart does not include any statistical output or analysis that would indicate that its going north. we are right at its mean. all you are showing is a distribution of price ?
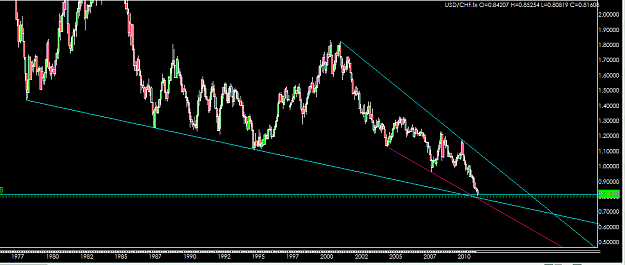
we have got an easier tool for you to use. pick a range, find a mid using fibonacci tool . and go long