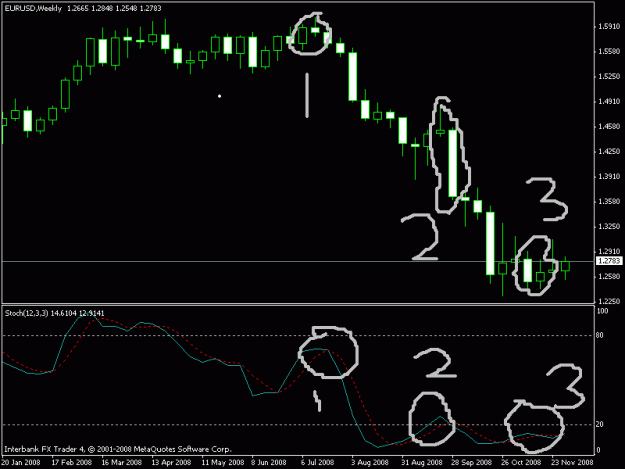
hey FXLANE if you follow Eu weekly charts then check out my chart below which clearly shows technicals of the currency and justify this fall.
On the chart the:
1) Bearish Harami and stochastic was bullish which showed a reversal was due
2) Bearish Engulfing and stochastic was bullish and 'overbought' which meant further weakness.
3) Bullish Harami and stochastic is slightly bearish and in overbought zone which means a move up and if u had bought @ the close of the candle that was 1.2643 now u wud hav been up around 130 pips and target is upto u to decide.
Attached Image (click to enlarge)