DislikedYou're over-analyzing things and switching up your idea of what the market is doing.
Zoom out to the daily, weekly, and monthly charts. Remove all indicators. What is price doing?
Now add one or two indicators and/or trendlines and wait for the market to present a trade to you.
Good luck.Ignored
and i guess you're right, i am over-analyzing..i really do tend to do that. but that's kinda where i'm comin from as well, i guess u can say from a theoretical point of view i'm trying to understand a market that seemingly is driven only by pure sentiment at the moment... i just always thought that the correlation between economic data in the US and the movement of the USD would hold. apparently not.
thanks for your advice. i usually trade alot intra-day, hence minute chart which i observe. but i pulled out and had a look at the daily and weekly data. im still trying to grasp the whole concept of TA so please correct me if you think otherwise..
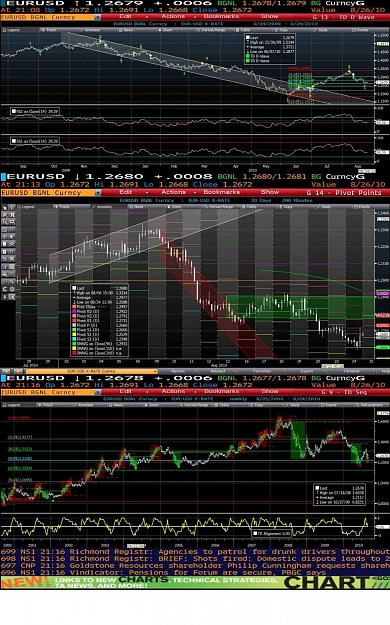
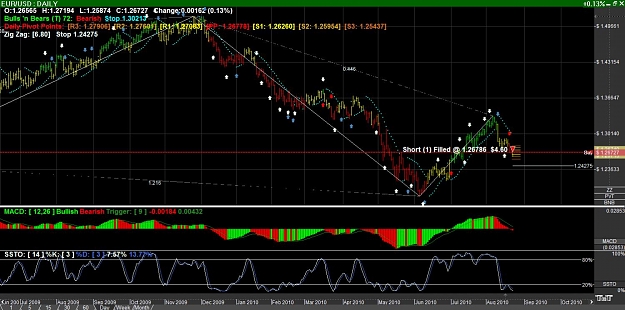
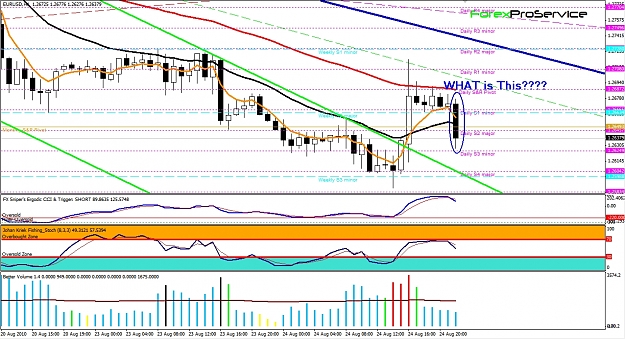
the first chart is a daily chart where i observed a strong downtrend. following which it bottomed and retraced back to 1.33ish. then began trending back down again (although again i note some kind of plateauing out at the 38.2% fib level around 1.2793 and again now at around 1.26 to 1.27 level, lots of range trade intraday and kind of flattening out. From here, it still looks like a downtrend but i am thinking it could retest the 38.2% fib level first? Also noted the H&S formation...would that be considered confirmed now that we broke 1.26 today?
2nd chart i looked at the 4 hour pivots over last 20 days, sorry its abit chaotic, doesnt look as clean as the ones most users post here..the lines support and resistance lines dont quite join up. anyway, looks like we were mostly range trading for like a week before it broke through the range downwards...looks like its trying to retest the bottom of that range? just my humble opinion...would like to hear other views as well as i am a noob at chart interpretation.
lastly, i looked at the weekly chart over the last 10 years. from here it clearly looks to me that we could hit the 50% fib level at 1.2188, but could it be a possible double bottom formation?? possibly pushing it back up over the 1.4 level again if confirmed??
look forward to hear your views on if i the way i am reading this makes sense to you or not... lastly, since i trade intra-day alot, is it important that i look at the daily, weekly or monthly charts? or is this just to determine the general direction if i would plan to hold a trade longer than a couple of weeks..?
(btw..seems like i am not allowed to upload more than a certain size limit..how do you guys manage it? do you always have to delete your old charts from old posts before you can upload a new one again?)
thanks alot for all your help!
Attached Image (click to enlarge)