DislikedYour explanation is strong and as I said you may be right on this trade ....You could be awesome...... but I was just saying it's risky for me....I am an elliottican so I look at big moves and down to a momentum system with entry emphasized on 10 min charts. so maybe I just dont see the small moves
Could you PM me on explaining to me your money management because if the impulse move did start I would like to know where is the good exitIgnored
No need to pm. I find that what is stated here will be beneficial to at least one trader out there of the hundreds reading. Elliot waves. It would help everyone including myself if you posted charts of how you measure Elliot waves. In the beggining I used to use Fibonacci to track 61.8% retracement for every move. So if pa went down 100pips..draw fibonacci for that up to bottom then went 70 pips back up draw fibonacci for that then if next move is 40pips back down draw fibs for that..and so on. Where the highest amount of 38.2% to 61.8% intersected, I knew that was the level to be watching for entry for the next move, whether long or short, scalp or not. 2 years later, I can see that with the naked eye.
Whoa got off track..back to your questions.
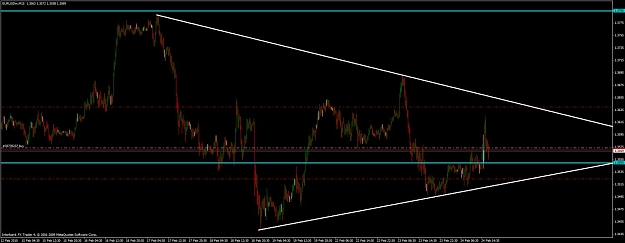
As I said earlier....the market is in consolidation mode right now. You can read the post a few hours back. The consolidation is currently in an equilateral triangle. Within the triangle there is a pivotal point at 1.3550. When we broke below it, there was barely any strength to go lower, as proven by the reaction to the initial homes sales data. After some time as Bernanke speech went on, and his comment of (wont increase fed rates for an extended period), I knew the market makers did not want to push pa towards the lows again as there is no reason to. Not at this point in time. So I looked for the first retrace back down after the initial move up that came because I felt and still do that the market makers want to push this higher. As 1.3575ish was where the high of the range in the last 24 hours was, that was my entry. My stop loss on this pair is always 50pips which puts me below that pivotal 1.3550 on the longer timeframes as I do not see it breaking. Now while I may see potential for pa to reach 1.38 as its a heavy support/resistance level since March of last year, the upper wall of this equilateral triangle is my current target, there is also heavy resistance/support in that area as visible by my red dotted take profit line.
Does this explain it all? Feel free to ask anything. I too ask in return for a chart of your Elliot waves. Please do share
Attached Image (click to enlarge)
Different opinions highly valued, ignorant to slander.