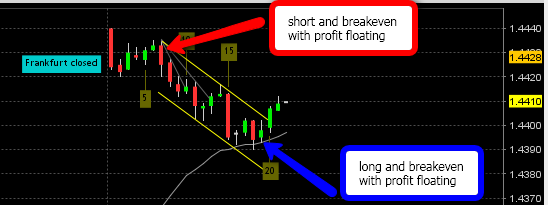
that only 2 trades sample, actually on that chart it have multiples stoploss hit, multiple breakeven hit, multiple profit floats. As price continue flows if there is a trend(up/down) the oldest floats will generates the biggest profit, and when its sideways or choppy it will always have multiple stoploss hit & multiple breakevens & few profit floats
if someone thinks this way is stupid way its ok i accept that, but that how my brain works, and no hedge is disabling me.
Attached Image