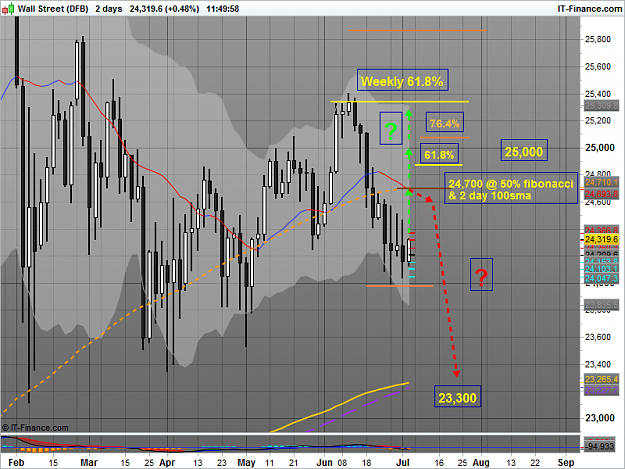
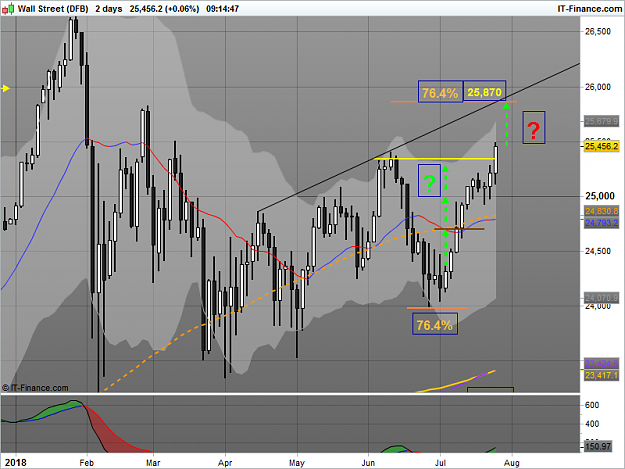
The title and the question mark, because nothing is certain in this game, but it looks to me as if the Dow Jones, and with it all of the major global stock markets, may well be pushing up one more time to resistance before turning and putting in some big falls. When? I would say imminently, and by imminently I mean sometime this month or next.
If I turn out to be right, then the warning may alert a few people to be vigilant for what could be a great sell opportunity, and if I am wrong, and stocks continue to sail north beyond the levels on my chart, then no harm done.
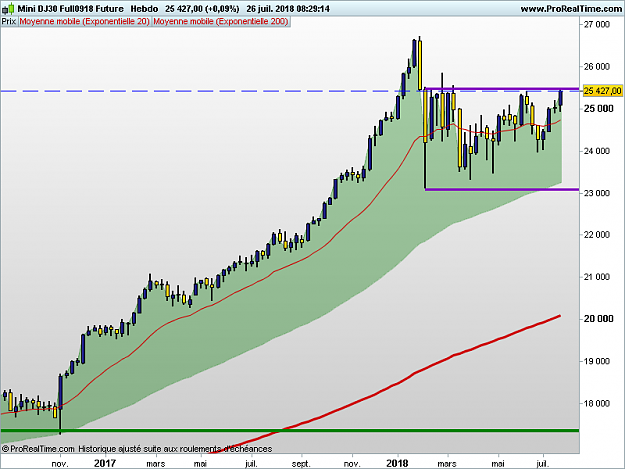
The chart is hopefully pretty self-explanatory. 24,700 isn where I see the first level of potentially strong resistance, if indeed it gets that far, and if it does and continues north, then around 25,000 will create a very nice head and shoulders pattern, the left shoulder obviously being the 21st May high.
One more thing to mention is the very bearish monthly shooting star candlestick for June. The price does not always drop immediately after such a candle, it can do for sure, but just as often such a candle can be seen as a forewarning of what is to come.
Feel free to add anything you want to this thread, your own analysis or whatever, all posts are welcome as long as they are constructive. Any abuse or pointless criticism and the poster will immediately be banned from all my threads. Sorry, but after posting on ff for so many years, I've had my fill of smart asses. Serious posters and traders only please.
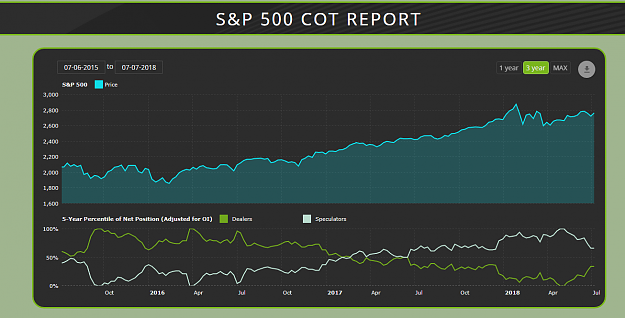
Also, if anyone wants to give any correlation with what is happening in the forex market or in commodities, then please feel free, as this thread is designed to help, nothing more. Similarly, if anyone has a fundamentals take on how things stand at the moment, whether it supports a big sell off in stocks or not, then that would also be most welcome.
Oh, and one more thing. Look at the 76.4% fib support plotted from the 2nd May low ( short orange line ). I was watching this level and so far the support has held perfectly.
If I turn out to be right, then the warning may alert a few people to be vigilant for what could be a great sell opportunity, and if I am wrong, and stocks continue to sail north beyond the levels on my chart, then no harm done.
The chart is hopefully pretty self-explanatory. 24,700 isn where I see the first level of potentially strong resistance, if indeed it gets that far, and if it does and continues north, then around 25,000 will create a very nice head and shoulders pattern, the left shoulder obviously being the 21st May high.
One more thing to mention is the very bearish monthly shooting star candlestick for June. The price does not always drop immediately after such a candle, it can do for sure, but just as often such a candle can be seen as a forewarning of what is to come.
Feel free to add anything you want to this thread, your own analysis or whatever, all posts are welcome as long as they are constructive. Any abuse or pointless criticism and the poster will immediately be banned from all my threads. Sorry, but after posting on ff for so many years, I've had my fill of smart asses. Serious posters and traders only please.
Also, if anyone wants to give any correlation with what is happening in the forex market or in commodities, then please feel free, as this thread is designed to help, nothing more. Similarly, if anyone has a fundamentals take on how things stand at the moment, whether it supports a big sell off in stocks or not, then that would also be most welcome.
Oh, and one more thing. Look at the 76.4% fib support plotted from the 2nd May low ( short orange line ). I was watching this level and so far the support has held perfectly.
Attached Image (click to enlarge)