Tick Chart brought me some attention since many price action trader uses. We share some more complete version of tick chart for traders.
Of course, all is free to use and free to share.
Most important factor to use Tick chart is that it is not based on the fixed time interval like normal Meta Trader chartings.
It is rather based on the counting of ticks arrived.
Therefore identical number of ticks are forming each candlestick. This is unique property of the tick chart.
When I collect 100 ticks it took about 100 seconds in average. So I reckon using 100 tick chart will be more or less like M1 chart.
1000 tick chart will be equivalent to around 15 minutes I guess.
Some good scalper uses 71 tick chart for some perculiar reason.
With Renko charting together, this tick chart will provide you some edge which is not offered by traditional time based chart.
But this advantage also there too. During the quite market, forming one candle can take quite long time.
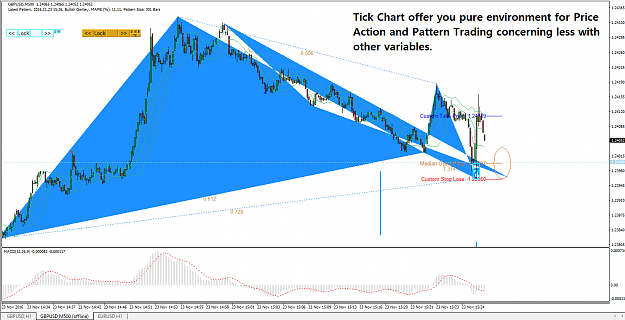
So here is the tick chart you can use for your Price Action and Pattern Trading.
Below is the description for input variable for this tick chart. You can even load thick chart from your own history.
Below is description for input variable.
* Tick Count: How many ticks to count in each candle. You can use any ticks including 20 ticks, 50 ticks or 100 ticks, etc.
* Time Frame to Store Tick Chart (Must be unique for each tick chart, avoid 1, 5, 15, 30, 60, 240, etc)
* Filter out the same bid or ask price: (Set to true if Tick Count < 20): If your tick count is smaller than 20, then must set this to true
* Use Bid Price: true or false only (false = Ask price) : as a default you will use bid price to build tick candle
* Delete Existing Tick Chart during Initialization: true or false only. Set this to true to automatically delete existing chart with same name.
* Start at New Candle Open: true or false. Set true, then Real Time Tick Chart will wait until opening of new candle open. Set false, to start to collect tick immediately.
* Timeframe for New Open Candle: set timeframe to start to collect ticks (if Start at New Candle Open = false, then this input is not used.)
* Build Offline Chart from CSV File: true or false only. When you want to run real time tick chart, this must be set to false
* Write Tick Chart History: true or false only. Only set this to true if you need to save the data for later use.
* Tick Chart History Name for csv file: set any name you wish.
Here you can read some articles about tick chart.
http://www.investopedia.com/articles...-intervals.asp
http://daytradingacademy.com/indicat...ts/tick-charts
http://www.tradeciety.com/the-power-...w-to-use-them/
http://eminimind.com/tick-chart-heik...lestick-guide/
Of course, all is free to use and free to share.
Most important factor to use Tick chart is that it is not based on the fixed time interval like normal Meta Trader chartings.
It is rather based on the counting of ticks arrived.
Therefore identical number of ticks are forming each candlestick. This is unique property of the tick chart.
When I collect 100 ticks it took about 100 seconds in average. So I reckon using 100 tick chart will be more or less like M1 chart.
1000 tick chart will be equivalent to around 15 minutes I guess.
Some good scalper uses 71 tick chart for some perculiar reason.
With Renko charting together, this tick chart will provide you some edge which is not offered by traditional time based chart.
But this advantage also there too. During the quite market, forming one candle can take quite long time.
So here is the tick chart you can use for your Price Action and Pattern Trading.
Below is the description for input variable for this tick chart. You can even load thick chart from your own history.
Below is description for input variable.
* Tick Count: How many ticks to count in each candle. You can use any ticks including 20 ticks, 50 ticks or 100 ticks, etc.
* Time Frame to Store Tick Chart (Must be unique for each tick chart, avoid 1, 5, 15, 30, 60, 240, etc)
* Filter out the same bid or ask price: (Set to true if Tick Count < 20): If your tick count is smaller than 20, then must set this to true
* Use Bid Price: true or false only (false = Ask price) : as a default you will use bid price to build tick candle
* Delete Existing Tick Chart during Initialization: true or false only. Set this to true to automatically delete existing chart with same name.
* Start at New Candle Open: true or false. Set true, then Real Time Tick Chart will wait until opening of new candle open. Set false, to start to collect tick immediately.
* Timeframe for New Open Candle: set timeframe to start to collect ticks (if Start at New Candle Open = false, then this input is not used.)
* Build Offline Chart from CSV File: true or false only. When you want to run real time tick chart, this must be set to false
* Write Tick Chart History: true or false only. Only set this to true if you need to save the data for later use.
* Tick Chart History Name for csv file: set any name you wish.
Attached File(s)
Attached File(s)
Here you can read some articles about tick chart.
http://www.investopedia.com/articles...-intervals.asp
http://daytradingacademy.com/indicat...ts/tick-charts
http://www.tradeciety.com/the-power-...w-to-use-them/
http://eminimind.com/tick-chart-heik...lestick-guide/
Attached Image (click to enlarge)