OK, it's time for me to ask the big question!
For over 3 years, I've been trying to find a long-term successful strategy in Forex, but in vain! When I say 3 years I am talking about something like 5 to 10 hours a day!!! In a way, I've wasted 3 years of my dear life. I am one of the best computer programmers you can see in your life; I'm absolutely good when it comes to mathematics and statistics/probability theories. I have tested hundreds of different strategies (both mechanical and manual).
I know nearly all the possible answers that you or other members may come up with:
- Maybe you're not capable of trading. It's YOU who's caused the problem.
- Trading is an art. You can't measure it with computer programs.
- You're just another loser looking to find excuses.
- I've seen millions of successful strategies on the Internet
- This is not the right forum to discuss it. Go somewhere else.
- ...
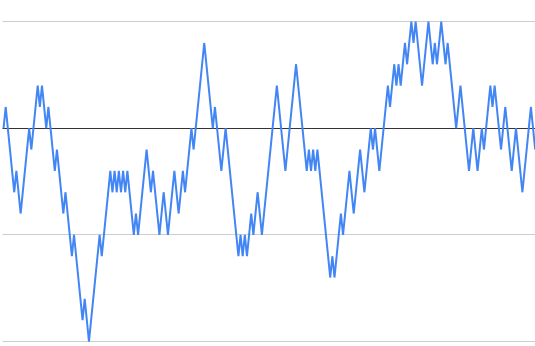
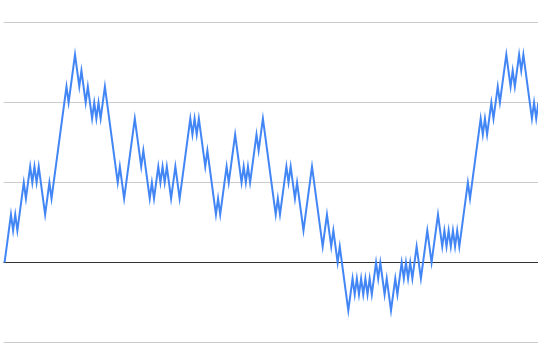
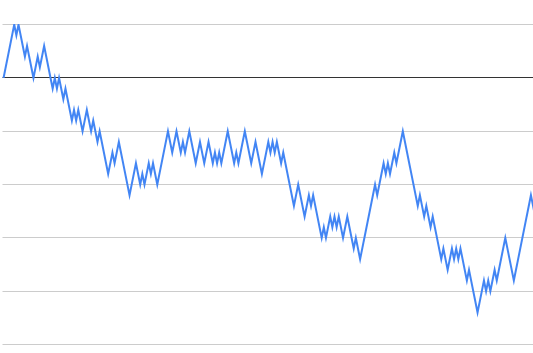
Before I further explain my point, take a look at the following three charts and guess which currency-pair they are AND in which time-frame? Please do it right now and see the attachments.
I will let you know the answer at the end of this post.
One of the most frustrating (I would use a different adjective!) answers I've ever heard is that you're not supposed to ask Forex teachers to see their trades. This is probably the most strange/unfair argument I can imagine. This is not a joke! This is about students precious life. It's their RIGHT to know, beforehand, the path they're stepping into has been ended in success before. Otherwise it's like buying a car by only listening to the seller's words and not actually seeing and driving the car! If the problem is their privacy, they can simply blur/disappear the numbers and show us the equity curve itself.
And now the final part, why showing their results for anything less than 3 years is useless? Because market condition changes all the time. in some years you could win big money only by flipping a coin! For example a given currency-pair could trend for the whole year 2017 in which case even the most ridiculous trend-following strategies would result in some amazing trades. But, this doesn't count. We need to see the results of a strategy AT LEAST FOR THREE YEAR to call it a successful strategy. You don't believe my words? OK, see the next paragraph.
Did you manage to guess which currency pairs AND which time-frame the attached images are showing? Ladies and gentlemen, they are nothing but a series of absolutely random numbers produced by Google Sheet! You can successfully insert Stochastic, RSI, trend lines, Fibonacci etc on it and they all work!!! Look how in some parts you could say "the chart is reacting to Support/Resistance levels"! What does this mean? like I said, even flipping a coin can produce a chain of successful trades, which is why I said we cannot call a strategy/trader successful until we see the results at least for 3 years.
I am not going to be a negative-energy-emitting person ruining your dreams and hopes. All I am saying is IT'S YOUR RIGHT TO KNOW, IT'S YOUR LIFE YOUR SPENDING. I would be more than happy (actually carried away) to see the results of trading a real account and for three years in a row here in this forum in which case I will start to study all the forum's posts word by word, taking notes of them, even if it takes a year or so.
Is there anyone on this forum who is willing to show his/her results? Come on, please give us some hope ![]()
WE NEED TO SEE A CURVE (doesn't have to have numbers on it, just a graphical (equity) curve)
Thank you very much.