UPDATE! Now the whole grid setup is integrated into one EA. (no more separate indicators) So it runs great, and should be much easier for some people to install the system. Also all settings are easily accessible from one place (press F7 or click in the upper right corner of the chart). I also added new feature - You can create SnapShots of any chart/grid with one click. Also there is the option for automatic snapshot every time you open or close a trade. All snapshots are saved automatically in directory - MT4 folder / MQL / Files /..... You can...
Ignored
TY so much AO. This is very easy to install.
I tried the snapshot button and don't see the saved chart.
Also checked my setting. Snapshot = True.
Thanks in advance.
KC.
Edit :- Works like a charm. TY. Did a search on my entire hard disk. It created the chart image in Appdata ... TY really a nice work. Saves a lot of time.
UPDATE! Now the whole grid setup is integrated into one EA. (no more separate indicators) So it runs great, and should be much easier for some people to install the system. Also all settings are easily accessible from one place (press F7 or click in the upper right corner of the chart). I also added new feature - You can create SnapShots of any chart/grid with one click. Also there is the option for automatic snapshot every time you open or close a trade. All snapshots are saved automatically in directory - MT4 folder / MQL / Files /..... You can...
Ignored
Thanks AO, I like the snapshot feature very much. regarding about the auto snapshot for open and close trade. Can you add ticket number to the file and also add open/close word in the end of it. That way when we have more than 100+ snapshot , we can find files easily.
{quote} I watch the 10 most traded pairs(with highest volume and liquidity). I uploaded the configuration of my mt4 setup exactly the way I use it every day. The correlation between the pairs is VERY important indicator! That's why I watch all ten pairs as a whole, like one system! Most retail traders often forget about this fact, and many are not even aware. Also I try to think in terms of individual currencies not just pairs. Every time you see movement, you have to ask yourself which currency is actually moving? Is this Dollar strength? Or Euro...
Ignored
Hi team!
I am wondering if there would be benefit to building an indicator to give a dynamic representation of the pair correlation from AO's post #38. I think I have an idea for the math behind it if someone can code it as an indicator. there may be one out there already, but I have not been able to find it.
From my understanding, all three pairs must be in balance at all times. If there is change in one of the pairs, then the other will follow suit in some fashion. When a pair is out of balance due to a strong price movement, the other pairs will either:
1. Remain the same and the first pair will come back to original price.
2. One pair will remain the same forcing the last pair to move strongly to come into balance with the first pair.
The trick would be being notified when one of the pairs is out of balance and then to watch the money lanes to see which pairs have a possible trade entry to be made. This can also be used to confirm trades (I think). I will use one Triad of pairs as an example (EURUSD, USDJPY, EURJPY). This was just an idea I had that could be of benefit. I rely on AO's experience with the strategy to let me know if I am on the right track. I don't want to waste anyone time if I am completely wrong.
From what I gathered, if you calculate 1 pair, by another pair, you will come up with a value that is equal to the price of the third pair.
At this moment, the current prices for these pairs are:
EURUSD: 1.09968
USDJPY: 120.529
EURJPY: 132.543
So, to establish a base line to build an alert off of, we would check the math of this triad with each tick. I am not sure if spread would be a factor in this.
Calculate EURUSD * USDJPY should always EQUAL EURJPY price (if in balance)
Calculate EURJPY / USDJPY should always EQUAL EURUSD price (if in balance)
Calculate EURJPY / EURUSD should always EQUAL USDJPY price (if in balance)
Assuming, each of the 3 are in balance, we should have a base line.
On a chart, we could have the three PAIRS - I am sure it could get creative in presentation. Changing colors if it would help.
EURUSD
EURJPY
USDJPY
Under each pair would be the current price
EURUSD
1.09968
EURJPY
132.543
USDJPY
120.529
To see which is out of balance, each would be checked.
FOR EURJPY: Calculate EURUSD * USDJPY then subtract EURJPY current price
FOR EURUSD: Calculate EURJPY / USDJPY then subtract EURUSD current price
FOR USDJPY: Calculate EURJPY / EURUSD then subtract USDJPY price
In this example - all would be in balance based on current prices.
EURUSD
1.09968
0.0 Pip Variation
EURJPY
132.543
0.0 Pip Variation
USDJPY
120.529
0.0 Pip Variation
But lets test a spike on EURJPY where its price goes from 132.543 to 132.593. If we Calculate EURUSD * USDJPY then subtract EURJPY current price
With a deviation on the EURJPY, we know that if EURJPY continues its trend, one of the other two pairs will have to move in some direction to keep the triad in balance or the EURJPY will have to revert back to in balance or some combination.
As this numbers would change every tick, there should also be some user defined variable for how much deviation would constitute a useable deviation. Maybe if a deviation has to be 6 pips or greater to issue an alert or change color of the indicator? I don't know. Open to ideas but I wanted to jot them down for everyone to think about.
I could be completely bonkers here after too much Halloween candy, but there may be something here if someone wants to build it or play with it.
{quote} Hi team! I am wondering if there would be benefit to building an indicator to give a dynamic representation of the pair correlation from AO's post #38. I think I have an idea for the math behind it if someone can code it as an indicator. there may be one out there already, but I have not been able to find it. http://www.forexfactory.com/attachme...3&d=1443374981 From my understanding, all three pairs must be in balance at all times. If there is change in one of the pairs, then the other will follow suit...
Ignored
This has nothing to do with the Fibo grid......Your idea is excellent, however you are at least 10-15 years too late! What you are describing is a form of triangular arbitrage. You look for temporary mispricing in the calculations of cross currencies..and profit from the discrepancy(gap) between rates, risk free. This use to be a killer strategy in the nineties and early 2000(this was before retail FX even existed) and some of the first algo traders made millions scalping the exchange rates between major banks located on different continents.....but not anymore. Today computers are super fast, every broker, bank, or ECN is using colocation...and exchange rates calculations are perfectly accurate and synchronized. There is no more opportunities for arbitrage....
{quote} This has nothing to do with the Fibo grid......Your idea is excellent, however you are at least 10-15 years too late! What you are describing is a form of triangular arbitrage. You look for temporary mispricing in the calculations of cross currencies..and profit from the discrepancy(gap) between rates, risk free. This use to be a killer strategy in the nineties and early 2000(this was before retail FX even existed) and some of the first algo traders made millions scalping the exchange rates between major banks located on different continents.....but...
Ignored
Thanks AO, what I was referring to was not the Arbitrage factor, but the methodology used in the screen shot you posted on post #38. If there was a way to build an indicator that can be used on one screen to correlate strength of the different currency pairs in the Triad.
{quote} Thanks AO, what I was referring to was not the Arbitrage factor, but the methodology used in the screen shot you posted on #38. If there was a way to build an indicator that can be used on one screento correlate strength of the different currency pairs in the Triad.
Ignored
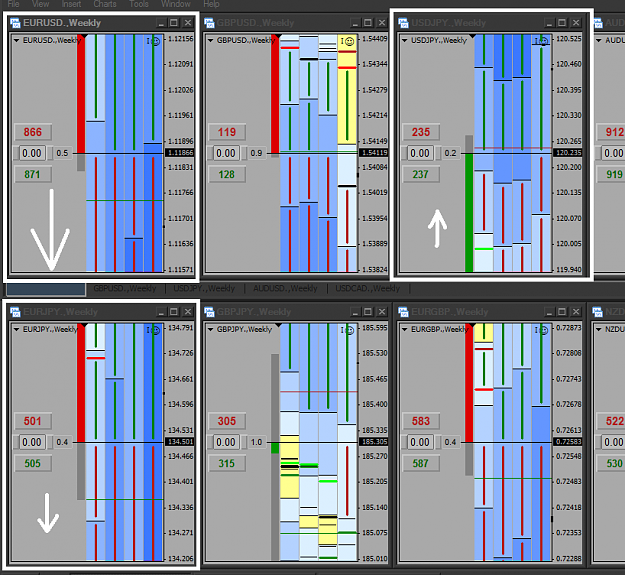
Hmm Ok. You look for currency strength indicator then. You want to determine which currency in a triad is the mover?
You need something like this but to show the distance in pips instead of percent...and to show only the currencies in each triad http://fxtrade.oanda.com/analysis/currency-heatmap
{quote} Hmm Ok. You look for currency strength indicator then. You want to determine which currency in a triad is the mover? You need something like this but to show the distance in pips instead of percent...and to show only the currencies in each triad http://fxtrade.oanda.com/analysis/currency-heatmap
Ignored
Getting closer. But as we are scalping for the most part, something measured on a tick by tick basis. And yes, only the three pairs. Of course you could have a setup for each triad. Maybe the use of arrows instead of pips as in your picture. If trading LONG on the EURJPY, you would also want to ensure the USDJPY and EURUSD are also moving LONG. This methodology could be used in conjunction with the condition of the lanes to help confirm whether to enter or not, or exit a trade early as another condition for exit should the strength vary in mid trade.
I will share once I have worked out the kinks in live market conditions. All based on the original Fib indicator, which is actually very well coded.
Cheers.
I will share once I have worked out the kinks in live market conditions. All based on the original Fib indicator, which is actually very well coded. Cheers. {quote}
Ignored
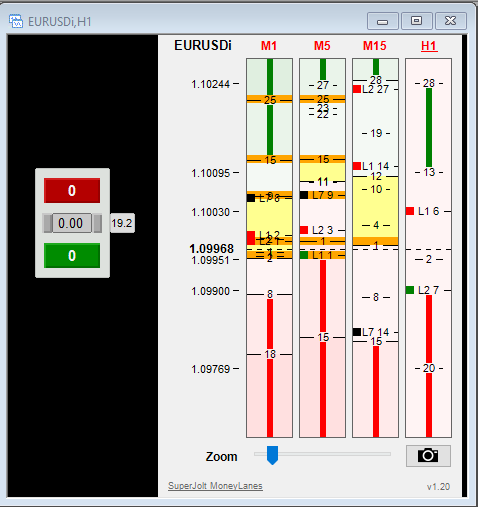
Attached Image
I have found SuperJolt's usage of the PIP values away from price to be extremely useful.
{quote} Getting closer. But as we are scalping for the most part, something measured on a tick by tick basis. And yes, only the three pairs. Of course you could have a setup for each triad. Maybe the use of arrows instead of pips as in your picture. If trading LONG on the EURJPY, you would also want to ensure the USDJPY and EURUSD are also moving LONG. This methodology could be used in conjunction with the condition of the lanes to help confirm whether to enter or not, or exit a trade early as another condition for exit should the strength vary...
Ignored
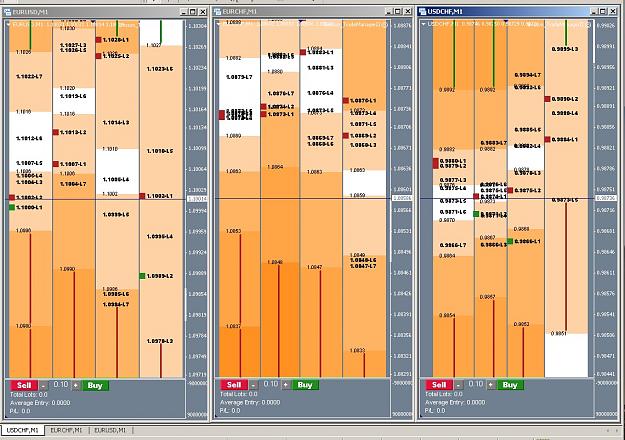
I understand what you mean, but you don't really need separate indicator for this! All you have to do is look at the grids side by side. Wherever there is a movement , it is always obvious which currency is the mover and where is the trend......you don't need other indicators to see this!? The grids are calculated over fixed scale so you can compare them side by side (you can't do than in normal charts... because the price scale is variable)
Here is a good example. Which currency is the mover? It is obvious that it's the EURO (going down)! And when you check the triad, what do you find? The EUR is falling the most against the USD because USDJPY is going UP, so EURJPY is NOT a good trade.
In this situation you have to trade EURUSD( the direction is irrelevant, you can go short or long, only the volatility matters)!
{quote} I understand what you mean, but you don't really need separate indicator for this! All you have to do is look at the grids side by side. Wherever there is a movement , it is always obvious which currency is the mover and where is the trend......you don't need other indicators to see this!? The grids are calculated over fixed scale so you can compare them side by side (you can't do than in normal charts... because the price scale is variable) Here is a good example. Which currency is the mover? It is obvious that it's the EURO (going down)!...
Ignored
I agree 100% that the data needed to make a decision is on the screen. And with practice it will come much easier. I was just thinking that there may be a cleaner way to look at 1 chart (EURUSD) for example and have the strength of the other two pairs EURJPY and USDJPY (in this example) shown on the EURUSD chart perhaps as arrows. Just as on the USDJPY chart, you would show the strength of the EURUSD and EURJPY as arrows. Just a brainstorming idea that over time and experience may be unnecessary.
Joined Aug 2010
|
Status: Stare Into the Lights My Pretties!
|779 Posts
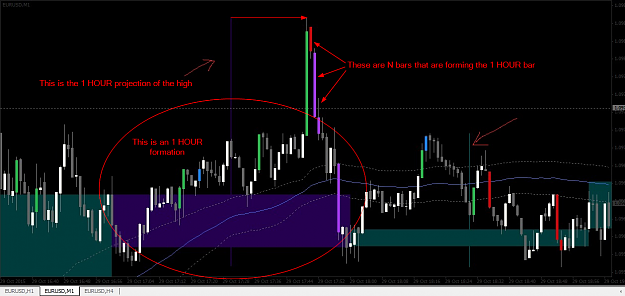
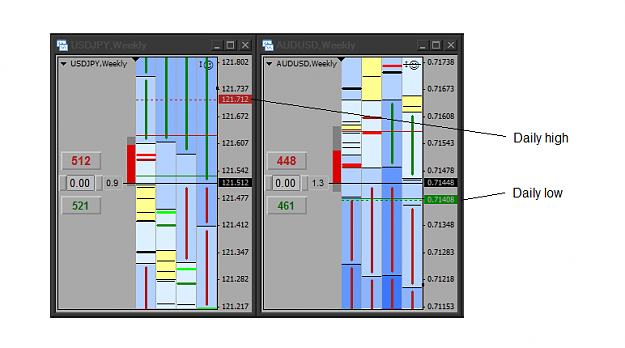
I added optional feature to display the highest and lowest price for the day. These are important levels (the big players often watch these levels and trade around them) so it always helps to know when the price makes new high or low for the day. Also they serve as good reference points.
I added optional feature to display the highest and lowest price for the day. These are important levels (the big players often watch these levels and trade around them) so it always helps to know when the price makes new high or low for the day. Also they serve as good reference points. {file} {image}
Ignored
Hi AO;
Fantastic, you have inspired me a lot to deal with this new method!
I'm still learning (I have a lot to learn), but slowly I get it slowly along Info and go "riding the puzzle."
(I apologize for my English, because I have no mastery of the language, and I use google translator to help me)
So I have to thank and go taking advantage of "opportunities".