Hi to all,
I decided to share my technical system and platform setup with the trading community. I am day trader/scalper, and for more than 2 years I have been using (with great success) this technical method called Dynamic Fibonacci Grid. I did not invent this method, just made a simple version of it to work with MT4. There are lots of traders around the world using different versions of this system so it is nothing new, but at least in my opinion this is one of the best methods for intraday technical analysis.
Now lets see why this method(tool) exist, why it so good, and what problems it solves.
I assume that most of you are well aware of the fact that the main goal in technical analysis is to determine the context of the market. In order to find good trading opportunities every trader first must know a few simple technical parameters:
1. The direction of the current trend (up, down, or sideways)
2. The volatility and the level of activity.
3. Potential zones of support and resistance.
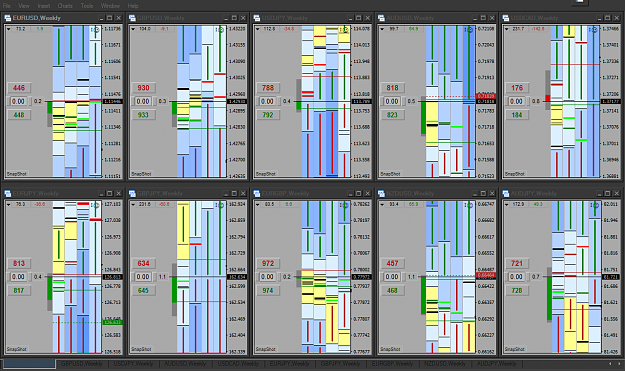
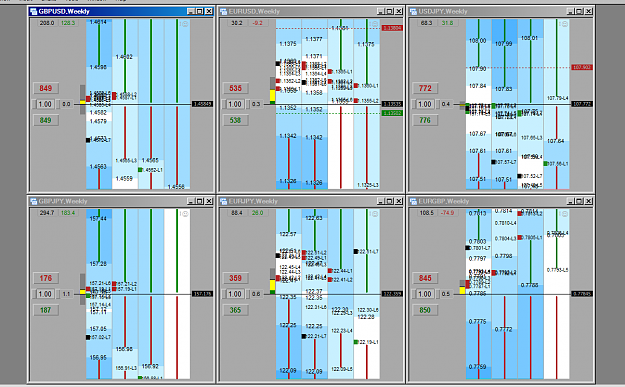
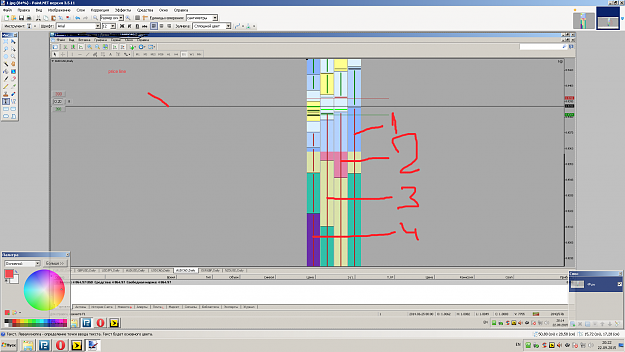
And these parameters have to be analyzed and determined in multiple time frames because the markets have fractal structure and most of the time there are several trends going in different directions (usually opposite to each other). So you have to look at multiple time frames simultaneously to find out what is the overall context. And here comes the first problem! When you start to look at multiple charts you very quickly find yourself confused because there is so much information (most of that information is useless) that it takes a lot time and effort for the brain to process and analyze in order to extract and separate the useful information from the noise. So it is very hard to watch more than one market and extract the useful information during fast market moves. And here comes the dynamic fibonacci grid. Acting as a filter automatically analyzes 4 time frames (1m, 5m, 15m, 1h) extracts only the useful information and presents it in an easy to read format.
So without even looking at any charts you can instantly (in seconds) see the key technical parameters (direction/trend, strength, zones of support/resistance) on multiple time frames simultaneously. So you determine the technical context without wasting time and energy doing the traditional analysis (looking at charts and drawing lines).This is especially helpful during fast moves. Correctly determining the context is crucial during high volatility because it eliminates the emotions and it puts you on the correct side of the market, so you can act quickly and without hesitation when the opportunity presents itself.
One example:
The market is making fast move up. You look at the grid and instantly see that the overall context is pointing down (5 min, 15m and, 1 hour are trending down) so in this situation you do not chase the up move (the probabilities are not your favor). Instead, look for the resistance zone (for potential short position).
Another example:
The market is moving up. You look at the grid and instantly find out that all four time frames are pointing up and there is no major resistance. In this situation you are looking for long positions. Usually wait for pullback.
OR, if the market is overbought and reaching strong zone of resistance (on multiple time frames) you can also look for short position (counter trend).
Another problem for scalpers and day traders is managing multiple positions during fast markets. It is absolute must to have platform with user friendly interface where you can easily (fast) get in and out, adjust lots and trail stops with one click. Also you need to be able to clearly see the status of your positions (size and P/L). The default MT4 interface is not very suitable for manual scalping and fast trading. Also the ticket based system is terrible way to keep track of your positions. You need a proper position based system(average fill price, total size, and total net P/L for the position) You also need the ability to close the entire position with one click, no matter how many individual trades are in that position.
The quick buttons on my grid interface solve all these problems!
With this new simple interface you can do the following:
Get in and out of positions with one click.
Partial position closing with one click.
Full position closing with one click.
Adjust lots with one click.
Manual trailing stops with adjustable step (with one click you can trail multiple stops).
Automatic preset stop and target on every trade.
Execute multiple trades with one click.(splitting of positions if you plan to scale out later).
Monitor and manage your exposure and P/L on position based system.( not on individual tickets).
Everything directly from the grid (chart), perfect for scalping. No more separate windows or crappy (slow navigation) mt4 interface.
------------------------------------
So in a nutshell why I think this grid system is so good?
1. Because it is proven technical system (it stood the test of time)! Based on solid market principles, it is 100% math (moving averages, fibonacci ratios, multi time frame fractal analysis.....)! Around the world hundreds of traders (including me) use this system successfully on a daily basis.
2. Automatic analysis. Dramatically reduces the time and effort needed for successful trading.
3. VERY systematic and consistent methodology! You see the same patterns repeating over and over. So it is easier to learn and master the high probability trading setups.
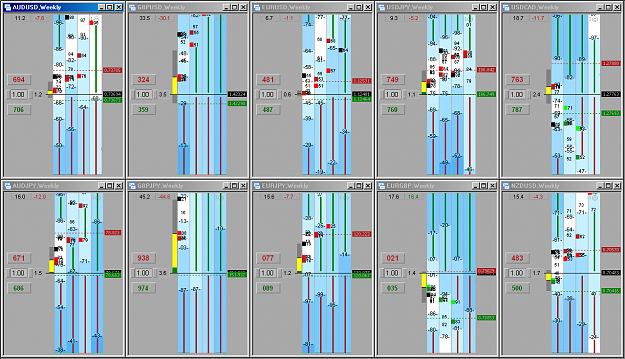
4. Gives you clear picture about the technical context of the market across multiple time frames, and multiple currency pairs simultaneously in real time. Everything in one screen! Massive amount of useful information is extracted, compressed, and presented in easy to read format.
5. Easy and fast position management directly from the grid (chart). Every trading operation is done with one click.
-----------------------------------
However, please note that this is NOT the Holy Grail or automated black box (make money while you sleep type system). It is a tool for manual short term trading(scalping) with many functions (like a Swiss knife)! This is a different unconventional method for analyzing the markets. It gives you alternative technical point of view. It is discretionary system. You can use it in different ways. But you have to have at least basic knowledge of the markets and fundamentals, end enough experience if you want to win this game. This system(tool) will not turn you from a loser into a winner in 1 month. However if you want to dramatically improve your trading, this tool will make things easier. It allows you to see the markets from a different angle.
If you are interested and want to know more about how to trade with this method or just need more info about it, you can find many educational videos, examples and tutorials ( in youtube) uploaded by other traders who use this method. They explain things in more details. I will post some links below. Or you can just search in google.There is a large community based around this method. There are even some live trade rooms, but I don't know if they are still active.
Note that I am not professional programmer and my code is far from perfect (just like my English ), but it gets the job done. I welcome criticism but only if you provide better solution on how to improve the efficiency of the code or some new ideas for useful features.
You can use my mt4 setup as it is shown on the screenshots below. You can also change the setup in any way you want or adapt it to fit your trading style.
Also note that this grid system is originally designed only for the major FX pairs and major crosses. It will NOT work correctly on other markets!!! (it doesn't work on gold, silver cfd, futures or stock indices......) ONLY FOREX major pairs and crosses! (It works on any pair which contains 2 of these currencies: USD, EUR, JPY, GBP, AUD, CAD, CHF, NZD)
This is the simplified version. For easy and fast Installation just place the EA (I.ex4) in MQL/experts, and the template(Default.tpl) in the templates folder. Then start MT4 and just open the currency pairs you want to watch and trade (the template is loaded automatically).
For the original classic look of the grid (as you see it in the videos), here are the files and template:
This is the compact version if you want to fit many grids/pairs in one screen. I personally use this setup for the top 10 major pairs.
DFGX
I decided to share my technical system and platform setup with the trading community. I am day trader/scalper, and for more than 2 years I have been using (with great success) this technical method called Dynamic Fibonacci Grid. I did not invent this method, just made a simple version of it to work with MT4. There are lots of traders around the world using different versions of this system so it is nothing new, but at least in my opinion this is one of the best methods for intraday technical analysis.
Now lets see why this method(tool) exist, why it so good, and what problems it solves.
I assume that most of you are well aware of the fact that the main goal in technical analysis is to determine the context of the market. In order to find good trading opportunities every trader first must know a few simple technical parameters:
1. The direction of the current trend (up, down, or sideways)
2. The volatility and the level of activity.
3. Potential zones of support and resistance.
And these parameters have to be analyzed and determined in multiple time frames because the markets have fractal structure and most of the time there are several trends going in different directions (usually opposite to each other). So you have to look at multiple time frames simultaneously to find out what is the overall context. And here comes the first problem! When you start to look at multiple charts you very quickly find yourself confused because there is so much information (most of that information is useless) that it takes a lot time and effort for the brain to process and analyze in order to extract and separate the useful information from the noise. So it is very hard to watch more than one market and extract the useful information during fast market moves. And here comes the dynamic fibonacci grid. Acting as a filter automatically analyzes 4 time frames (1m, 5m, 15m, 1h) extracts only the useful information and presents it in an easy to read format.
So without even looking at any charts you can instantly (in seconds) see the key technical parameters (direction/trend, strength, zones of support/resistance) on multiple time frames simultaneously. So you determine the technical context without wasting time and energy doing the traditional analysis (looking at charts and drawing lines).This is especially helpful during fast moves. Correctly determining the context is crucial during high volatility because it eliminates the emotions and it puts you on the correct side of the market, so you can act quickly and without hesitation when the opportunity presents itself.
One example:
The market is making fast move up. You look at the grid and instantly see that the overall context is pointing down (5 min, 15m and, 1 hour are trending down) so in this situation you do not chase the up move (the probabilities are not your favor). Instead, look for the resistance zone (for potential short position).
Another example:
The market is moving up. You look at the grid and instantly find out that all four time frames are pointing up and there is no major resistance. In this situation you are looking for long positions. Usually wait for pullback.
OR, if the market is overbought and reaching strong zone of resistance (on multiple time frames) you can also look for short position (counter trend).
Another problem for scalpers and day traders is managing multiple positions during fast markets. It is absolute must to have platform with user friendly interface where you can easily (fast) get in and out, adjust lots and trail stops with one click. Also you need to be able to clearly see the status of your positions (size and P/L). The default MT4 interface is not very suitable for manual scalping and fast trading. Also the ticket based system is terrible way to keep track of your positions. You need a proper position based system(average fill price, total size, and total net P/L for the position) You also need the ability to close the entire position with one click, no matter how many individual trades are in that position.
The quick buttons on my grid interface solve all these problems!
With this new simple interface you can do the following:
Get in and out of positions with one click.
Partial position closing with one click.
Full position closing with one click.
Adjust lots with one click.
Manual trailing stops with adjustable step (with one click you can trail multiple stops).
Automatic preset stop and target on every trade.
Execute multiple trades with one click.(splitting of positions if you plan to scale out later).
Monitor and manage your exposure and P/L on position based system.( not on individual tickets).
Everything directly from the grid (chart), perfect for scalping. No more separate windows or crappy (slow navigation) mt4 interface.
------------------------------------
So in a nutshell why I think this grid system is so good?
1. Because it is proven technical system (it stood the test of time)! Based on solid market principles, it is 100% math (moving averages, fibonacci ratios, multi time frame fractal analysis.....)! Around the world hundreds of traders (including me) use this system successfully on a daily basis.
2. Automatic analysis. Dramatically reduces the time and effort needed for successful trading.
3. VERY systematic and consistent methodology! You see the same patterns repeating over and over. So it is easier to learn and master the high probability trading setups.
4. Gives you clear picture about the technical context of the market across multiple time frames, and multiple currency pairs simultaneously in real time. Everything in one screen! Massive amount of useful information is extracted, compressed, and presented in easy to read format.
5. Easy and fast position management directly from the grid (chart). Every trading operation is done with one click.
-----------------------------------
However, please note that this is NOT the Holy Grail or automated black box (make money while you sleep type system). It is a tool for manual short term trading(scalping) with many functions (like a Swiss knife)! This is a different unconventional method for analyzing the markets. It gives you alternative technical point of view. It is discretionary system. You can use it in different ways. But you have to have at least basic knowledge of the markets and fundamentals, end enough experience if you want to win this game. This system(tool) will not turn you from a loser into a winner in 1 month. However if you want to dramatically improve your trading, this tool will make things easier. It allows you to see the markets from a different angle.
If you are interested and want to know more about how to trade with this method or just need more info about it, you can find many educational videos, examples and tutorials ( in youtube) uploaded by other traders who use this method. They explain things in more details. I will post some links below. Or you can just search in google.There is a large community based around this method. There are even some live trade rooms, but I don't know if they are still active.
Note that I am not professional programmer and my code is far from perfect (just like my English
You can use my mt4 setup as it is shown on the screenshots below. You can also change the setup in any way you want or adapt it to fit your trading style.
Also note that this grid system is originally designed only for the major FX pairs and major crosses. It will NOT work correctly on other markets!!! (it doesn't work on gold, silver cfd, futures or stock indices......) ONLY FOREX major pairs and crosses! (It works on any pair which contains 2 of these currencies: USD, EUR, JPY, GBP, AUD, CAD, CHF, NZD)
This is the simplified version. For easy and fast Installation just place the EA (I.ex4) in MQL/experts, and the template(Default.tpl) in the templates folder. Then start MT4 and just open the currency pairs you want to watch and trade (the template is loaded automatically).
Attached File(s)
For the original classic look of the grid (as you see it in the videos), here are the files and template:
Attached File(s)
This is the compact version if you want to fit many grids/pairs in one screen. I personally use this setup for the top 10 major pairs.
Attached File(s)
DFGX
Attached File(s)


