Dan regarding your live trading..if you look over it from 2009 until now do you end up having more BE trades and small losses and HUGE winners or what have you noticed about the percentages of those 3 groups?
Personally in my trading i tend to see alot of BE trades and a handful of small losses and BIG winners.
[font=Comic Sans MS][size=3]Now on the topic of moving to BE. If your in a trade and it goes in your direction enough for you to move to BE but then reverses...
Ignored
Hi bboyomega83,
I would say the same as your answer... quite a lot of breakeven trades, a few losses and a few wins. This is where the men will separate from the boys - in having the patience for the right trade and the wins... but when you have the patience the wins are big!
If price took out my trade at breakeven I would continue to look for another entry at s/r as per the normal rules - I would only stop if price showed that the trend had changed. Generally speaking though this doesn't happen much when trading dailies (which is why I want to stay clear of the lower time frames for now as whipsaw trades happen with much less frequency on daily charts).
Hey Dan, First off i hope your son feels better soon, and second, i was just wondering what your total pips (roughly) was for last year ?. I know its not really important but i just want a general idea of how trend trading performs.
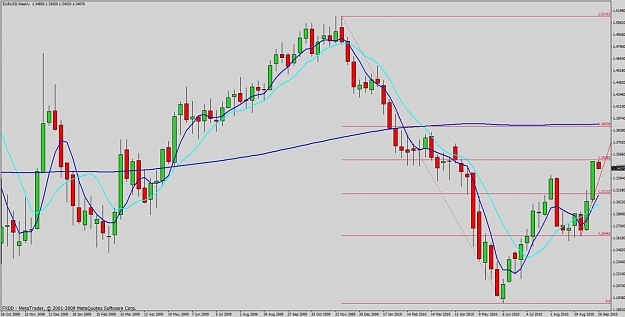
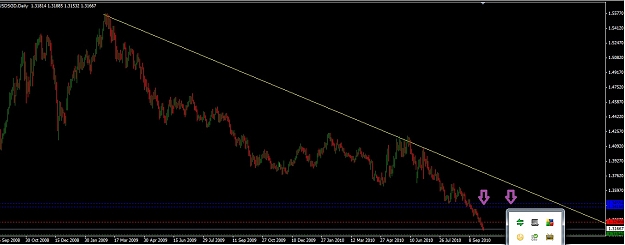
Dan , I include a weekly chart to show the 50% fib level at 1.3500 area from the highs of 11/29/2009. This would appear to me to be a good area to sell, if the trend is still down. Why not be looking for candles that will show the start of a new move down, & resuming a trend on a longer term basis? (please excuse the trendline showing from a shorter time frame that got included)
Thanks for sharing your system! It is really quite amazing and is so similar to the way that I have been slowly learning.
I have just two questions for now.
1: Which pairs do you look at?
2: How many pips spread is the max that you would consider when looking at a pair?
Thanks
Ignored
Hi PipRiderFX,
No problem, it's a nice, easy going trading method which is why I like it!
Answers to your questions...
1. I follow about 25 pairs, all the major crosses (USD/CHF/GBP/EUR/JPY/AUD/CAD) - I would stick with the majors and avoid exotics as there are plenty of opportunities to trade with these.
2. Spread isn't a major factor to me... I think the largest spread on the pairs I follow is about 6-8 pips, but that's a small price to pay on a 500/1000+ pip profit!
" If anyone has anything else that isn't clear please feel free to ask."
I want to be precise about this:
Exactly how and where do you draw your fibs.
I can see so many ways of drawing fibs that I have avoided them altogether.
Show us where you start and in which direction you draw them and so forth.
It seems like an easy thing to understand but it can get complex depending on which swing you start with and in which direction.
For the sake of example, would you please do it on the EURGBP?
Thanks for your help
Ignored
Hi Scarlett,
I tend to "fib" the most recent engulfing swing in the direction of the trend and I quite often draw them in conjunction with trendlines. For example, chart 1 is one view of the EUR/GBP using the outer trendline (assuming you believe the trend is down).
Now, just like with support and resistance there are times when you can draw more than one fib retracement. Chart 2 is a different view on the EUR/GBP... if I were looking to go long on this pair; I would be looking at this fib retracement.
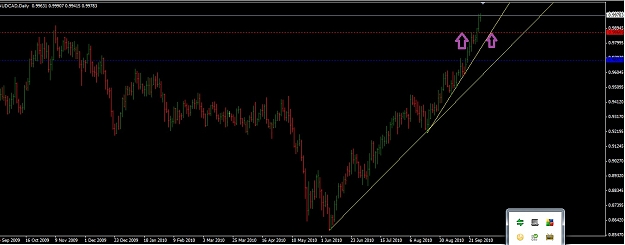
I have posted a small update to the AUD/CAD charts posted last week.
AUD/CAD:
- The pair continued it's movement up.
- There were some consolidating (inside) bars forming on 15/16 Sept. The price moved up above these earlier highs. The 20th saw a more convincing break upwards also towards the upper channel trend line.
- What would the price have needed to do to show you an entry?
- Or is it the fact this still below a significant trend line making a less attractive trade?
I guess I am trying to determine why this...
Ignored
Hi dmuk,
The basic rule for me is that if I am looking to go long I will be waiting for price to pull back to support. If I am looking to go short I will be waiting for price to pull back to resistance.
So in this example, AUD/CAD is not of interest to me because we are trading at a high. A good example of how I prefer to trade took place just a couple of days before (the 7th) where price had got above the 0.9500 level, pulled back to retest and formed a lovely bullish outside bar.
Anybody looking at Cad/Jpy. 82.00 looks like a major S/R area on the weekly. Formed a inside bar at this level on the weekly. Play a break either side ? Whats your opinion ?
Weekly
Daily
Ignored
Hi dan89,
I was looking for a sell in that area but didn't get a trigger!
Thanks for starting this thread. I really appreciate your style of teaching, and willingness to do so. I kept up with your Trend Trading thread, but I never got to the point of demoing the strategy because I was over my head trying to learn the James16 Price Action strategies.
In the James16 thread, the seniors always say that the candlestick size should be similar to the preceding bars in the recent trend. Do you factor in the size of the trigger bars and the surrounding bars in your analysis?
Ignored
Hi Location,
I don't think that applies so much to my trading. I would say if you were taking a counter trend trade then the size of the bar would be more important. Whilst a good sized bar is a better signal it is not essential to me - the most important factor is that it is at a significant location (and of course it is with the trend!).
the AUDUSD bullish outside bar you took - isn't this countertrend as price had just made a huge move down?
Ignored
Hi Pirabuji,
I had been selling before that but in my opinion price had rejected support around 0.8200 and moved higher up above 0.8500 before retracing back down and forming a bullish signal on the retracement - closing above the next level of s/r at 0.8500. That suggested to me that the uptrend was taking over again.
Please note that there is a difference though between entering near the beginning of a new trend once it has started to establish itself and picking tops or bottoms.
Dan , I include a weekly chart to show the 50% fib level at 1.3500 area from the highs of 11/29/2009. This would appear to me to be a good area to sell, if the trend is still down. Why not be looking for candles that will show the start of a new move down, & resuming a trend on a longer term basis? (please excuse the trendline showing from a shorter time frame that got included)
Shotshell
Ignored
Or, is price moving off of the 50% of the even longer uptrend...?
Thanks for your response but I'm still a little confused :S
Example in a downtrend if price rejects a key support area and forms a new higher higher would you consider the downtrend to be over? Or is it just your intuition?
On the recent EURGBP charts you have just posted, you have plotted fibs both ways, now price was mainly in a downtrend but has just made a new higher high, does this mean you will look for entries both sides and if you get a trigger bar which points in a direction you will take it? Or do you have a bias?
The AUDCAD chart you posted with the BUOB at 0.9500 was that a BE trade for you? Price approached the top of the swing high, I've read before this is the point or a key resistance area where you get to BE, if that's the case price retraced and would have closed at BE?
I had been selling before that but in my opinion price had rejected support around 0.8200 and moved higher up above 0.8500 before retracing back down and forming a bullish signal on the retracement - closing above the next level of s/r at 0.8500. That suggested to me that the uptrend was taking over again.
Please note that there is a difference though between entering near the beginning of a new trend once it has started to establish itself and picking tops or bottoms.
i'm new to this thread, juz finished reading the whole thread & wish to ask Dan how do we define whether the trend is UP or DOWN when it comes to the situation below?
For GU, the trend has been up, & then fall like hell, & now we can see that it's making higher high...so how would u define such situation? would u consider it as uptrend or downtrend?
|
Joined Apr 2008
|
Status: (Go-doe-thin)
|152 Posts
Hi Dan - I took the exact trade that you point out here and have since moved stop to BE - now waiting to see what happens and 'sitting on my hands' resisting the temptation to take 400+ pips.
The basic rule for me is that if I am looking to go long I will be waiting for price to pull back to support. If I am looking to go short I will be waiting for price to pull back to resistance.
So in this example, AUD/CAD is not of interest to me because we are trading at a high. A good example of how I prefer to trade took place just a couple of days before (the 7th) where price had got above the 0.9500 level, pulled back to retest and formed a lovely bullish outside bar.
Dear Dan, where do you see the most rliable support in euro/usd pair where price probably would bounce after retracement? I try to find an enter point in the euro trend,but can not find. Thank you,
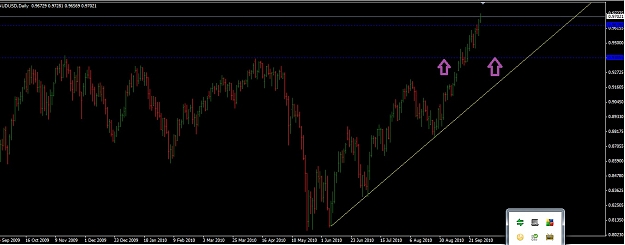
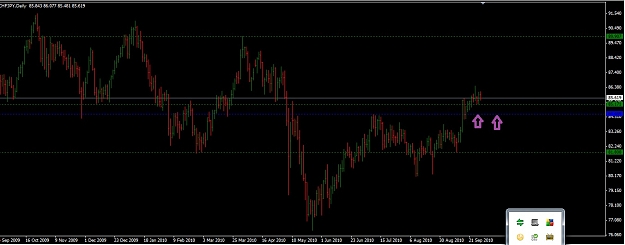
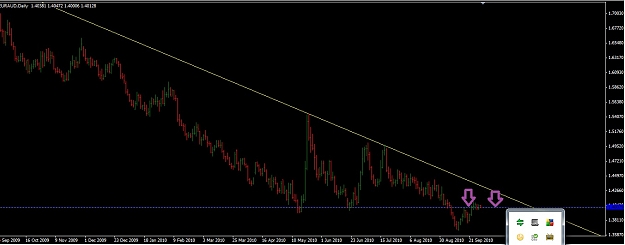
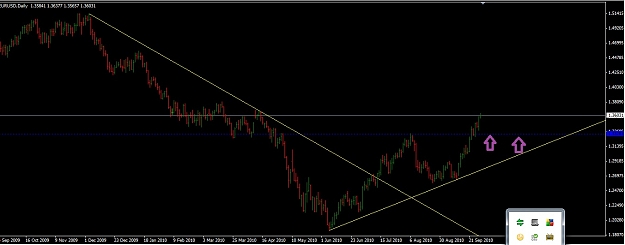
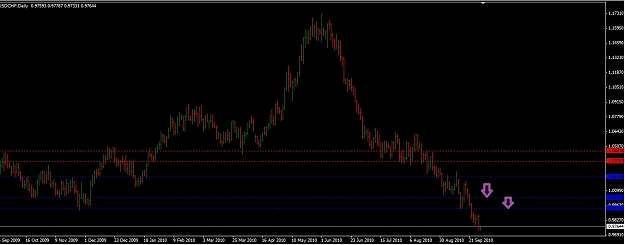
Dan can you give me your opinion on my charts below, i have marked possible entry areas with the arrows.
Ignored
Hi Bez - I'm far from being an expert, but those levels mostly match my own. I was fortunate in getting into the AUD/CAD on the previous (7 Sept) pullback so I'm waiting for a retrace any day now. If it goes back to the level you have marked or thereabouts I will be looking to add to my position based on PA at that level. No doubt Dan will have more to say.