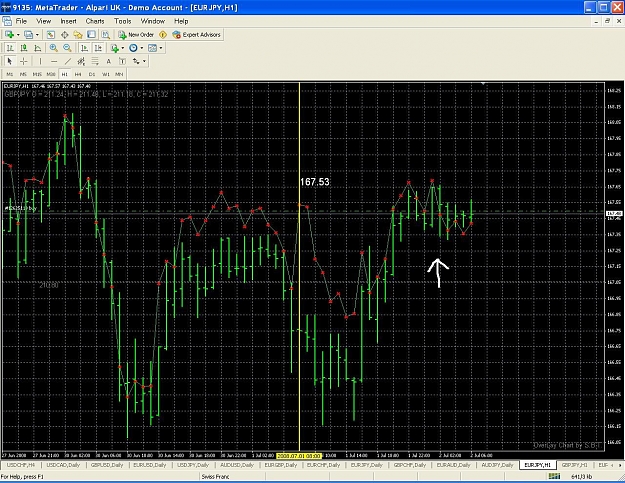
Here are two screen shots of the indicator at work on the 1H chart.
The first one was made last night before I went to bed.
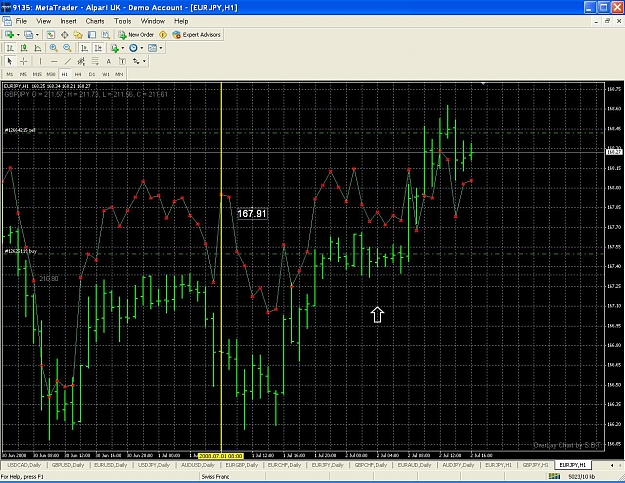
The second one was made this morning.
The computer and platform had been left on all night.
When the first one was made, the indicator had been in place for 5 or 6 hours. It was not finding its footing or whatever it has to do.
The yellow vertical line marked a peak that had been made by the indicator.
The price had shifted, overnight, upward by 38 pips.
The white arrows on the charts, are pointing at a cluster of bars, where the shift is very easy to see.
Originally, the indicator had been in the middle of these bars or below.
Overnight it had shifted well above them. Again, this shift was in the neighborhood of 30 - 40 pips.
You can visually scan both charts and see that the past indicator array has risen with time and/or price.
If you have painstakingly documented and proven that this indicator does not repaint, then we are looking at two different indicators, which we may be. The one in these screenshots repaints with a vengeance.
The one I used was dowloaded from post #27 on this thread.
http://www.forexfactory.com/showpost...8&postcount=27
I have not modified it. I am not a programmer and wouldn't know how to modify it if I wanted to.
PS- I just checked and the indicator array has risen another 19 pips since I made the last screenshot.
The first one was made last night before I went to bed.
The second one was made this morning.
The computer and platform had been left on all night.
When the first one was made, the indicator had been in place for 5 or 6 hours. It was not finding its footing or whatever it has to do.
The yellow vertical line marked a peak that had been made by the indicator.
The price had shifted, overnight, upward by 38 pips.
The white arrows on the charts, are pointing at a cluster of bars, where the shift is very easy to see.
Originally, the indicator had been in the middle of these bars or below.
Overnight it had shifted well above them. Again, this shift was in the neighborhood of 30 - 40 pips.
You can visually scan both charts and see that the past indicator array has risen with time and/or price.
If you have painstakingly documented and proven that this indicator does not repaint, then we are looking at two different indicators, which we may be. The one in these screenshots repaints with a vengeance.
The one I used was dowloaded from post #27 on this thread.
http://www.forexfactory.com/showpost...8&postcount=27
I have not modified it. I am not a programmer and wouldn't know how to modify it if I wanted to.
PS- I just checked and the indicator array has risen another 19 pips since I made the last screenshot.
Attached Image(s) (click to enlarge)