DislikedIf you have no objection I will change mine to match yours, and add the Day Open proximity indication. I think it would be good to maintain parity between the two tools.Ignored
Please feel welcome to use anything of mine. I'd like to help a fellow developer in any way that I can. I don't mind posting fragments of code if that helps, although I won't post the entire .mq4 source publicly without LauraT's permission.
Try the above formula and see if you get the same result as !SM_ADR Marker. I agree 100% about maintaining parity. And I'd welcome some confirmation that I've got the calculation right.
All the best,
David
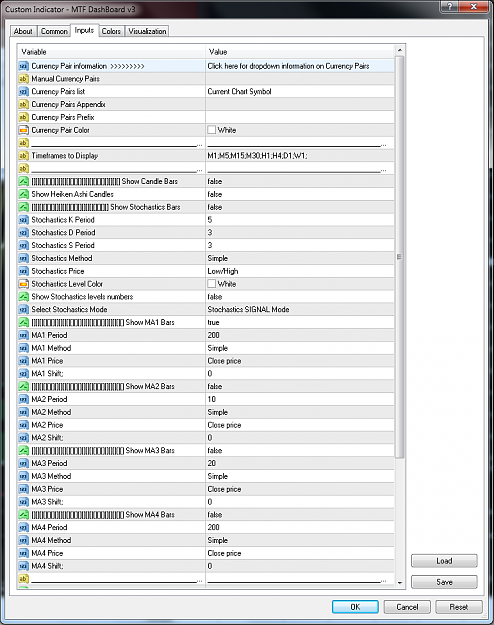
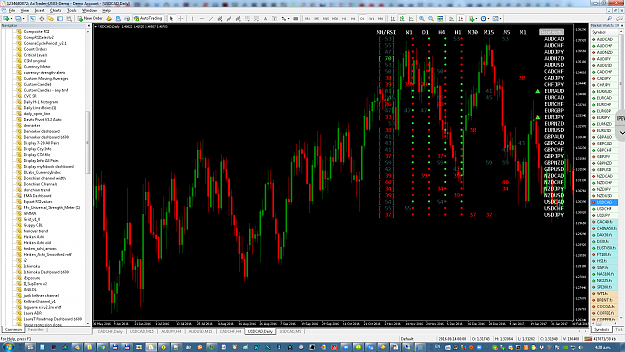
1. I have downloaded the road map dashboard b600 and CompRSIselect V2. I have attached both the indicators to one chart.
There's no harm in attaching the CompRSIselect V2 indicator, but it's not necessary (and will make MT4 run a bit more slowly). As long as the CompRSIselect V2.ex4 file is present in your ...../MQ4/Indicators folder, that's good enough.
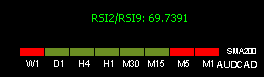
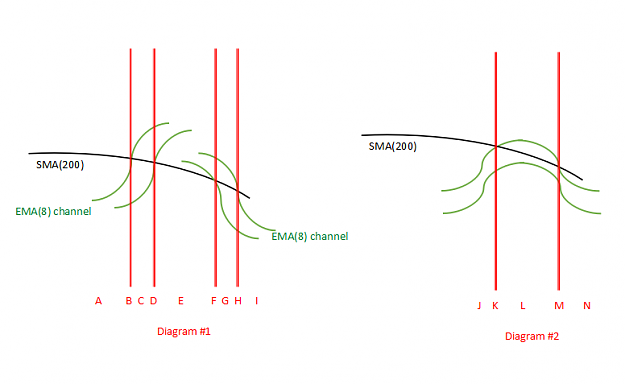
I get the table as posted above. I dont get any arrows but I get the numbers and colored dots which help me decide the trend on each timeframe. (bullish and bearish relative to 200 MA).
The arrows will likely pop up from time to time. They tell you that price is getting near to one of the horizontal likes on LauraT's template. There are 5 lines:
ATR High: ATR_High
ATR Low: ATR_Low
Yesterday's high: Yest_high
Yesterday's low: Yest_low
Today's open: Day_open
Just to confirm, I only have to attach the indicators to one chart , isnt it. Attaching it to any one chart will give me the info on all 28 majors.
Yes, attach the LauraT Roadmap Dashboard indicator to one chart only. The default settings will give you the info on the 28 majors. However you may add or delete any symbols from the Symbols parameter setting.
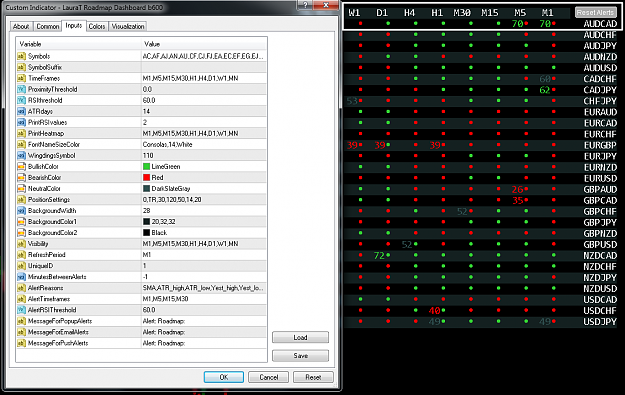
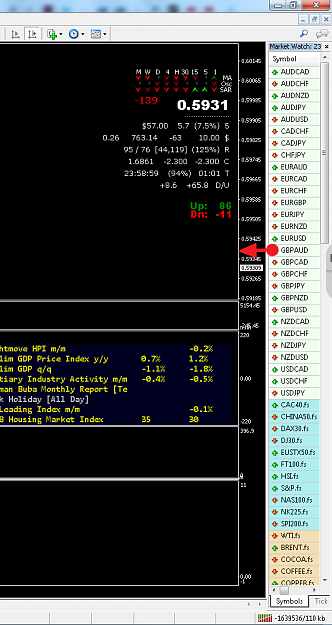
2. The box on right top superimposed on the price action and cannot see the bars.
It is the background that is stopping the candles from getting mixed in with the dashboard information. You can remove the background by setting BackgroundWidth to -1. But then the dashboard is harder to read because the candles get in the way (see screenshot below). Instead, I suggest opening a new 'dummy' chart and attaching the dashboard to it. You don't use that chart for anything else other than reading the dashboard, hence the candles don't matter.
So i have changed the box to bottom left. how did u manage to get the bars and price action on the left of the box in your initial post ?
The default setting for PositionSettings is 0,TR,30,120,50,14,20
The second value (I have underlined it in orange) can be any one of
TR=Top Right
TL=Top Left
BR=Bottom Right
BL=Bottom Left
There's more information about all this in post #1.
Attached Image (click to enlarge)
1