Hey guys,
Firstly I would like to take the time to appreciate how fast this dashboard was created and how it would improve trading the roadmap.
Secondly, I would like to thank hanover for once again giving his time to code such an efficient indicator that would shorten the scan timings required for multiple pairs.
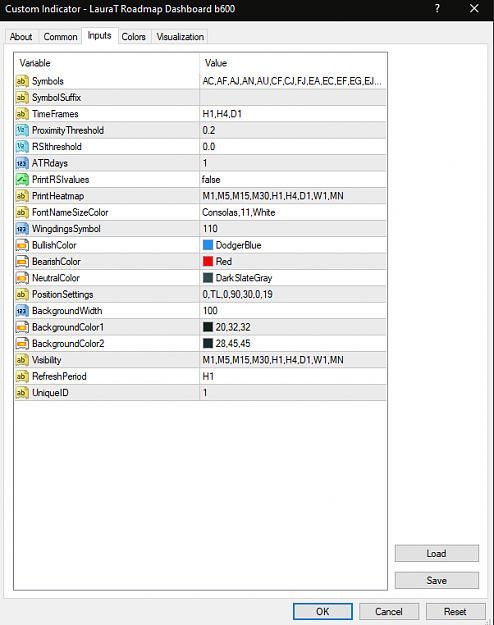
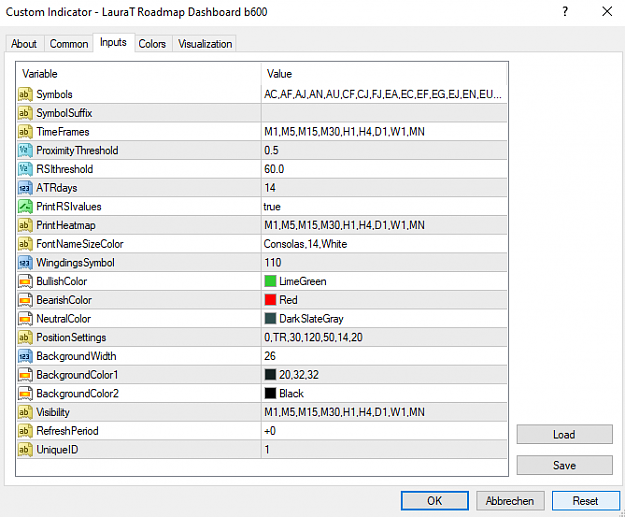
Notable settings that I have made are:
ATRdays set to '0'
PrintRSIvalues = 'False'
Proximity Threshold = '0.2'
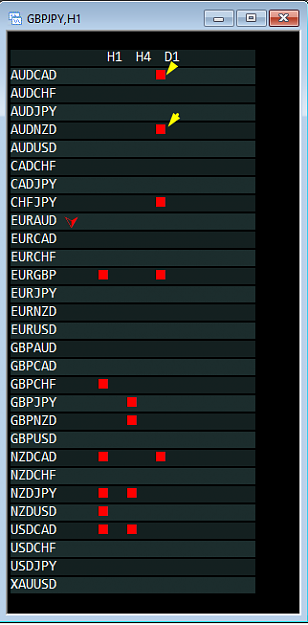
In short with the settings in my template, any box that lights up in the dashboard tells me that the channel is either touching, or brushing against the SMA in the respective timeframes.
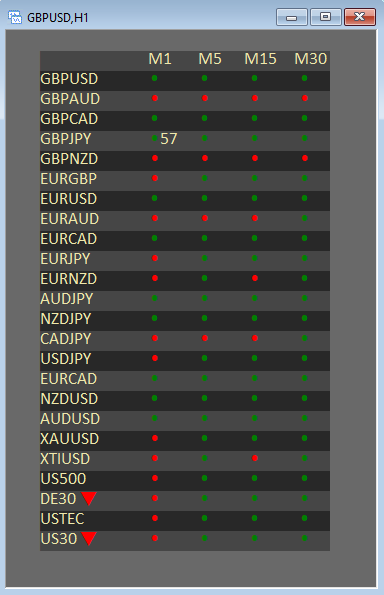
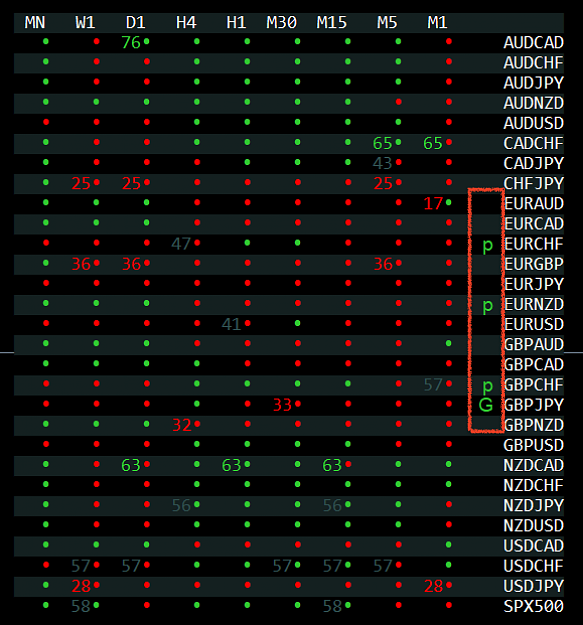
Red = RSI2/9: <40
Green = RSI2/9: >60
Beach = RSI2/9: 40 > x < 60
My personal template of which you would achieve the look of the dashboard shown is attached, feel free to modify it to your requirements!

(Simply download the template and copy it over to a fresh chart and shrinking the specific window to the desired size)
Firstly I would like to take the time to appreciate how fast this dashboard was created and how it would improve trading the roadmap.
Secondly, I would like to thank hanover for once again giving his time to code such an efficient indicator that would shorten the scan timings required for multiple pairs.
Notable settings that I have made are:
ATRdays set to '0'
PrintRSIvalues = 'False'
Proximity Threshold = '0.2'
In short with the settings in my template, any box that lights up in the dashboard tells me that the channel is either touching, or brushing against the SMA in the respective timeframes.
Red = RSI2/9: <40
Green = RSI2/9: >60
Beach = RSI2/9: 40 > x < 60
My personal template of which you would achieve the look of the dashboard shown is attached, feel free to modify it to your requirements!
Attached Image
Attached File(s)
(Simply download the template and copy it over to a fresh chart and shrinking the specific window to the desired size)
7