EURNZD Weekly Technical Outlook
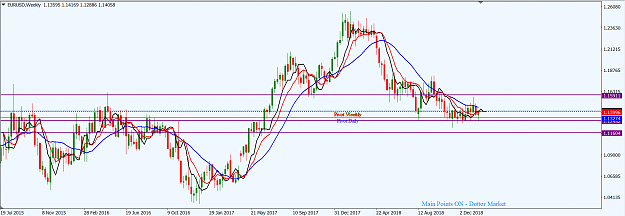
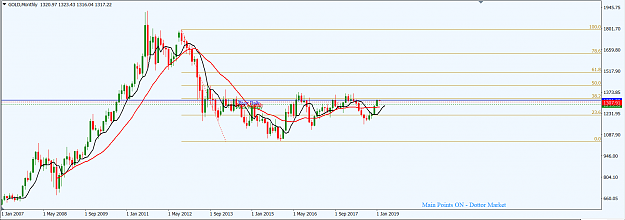
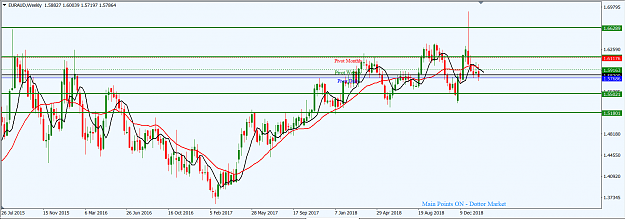
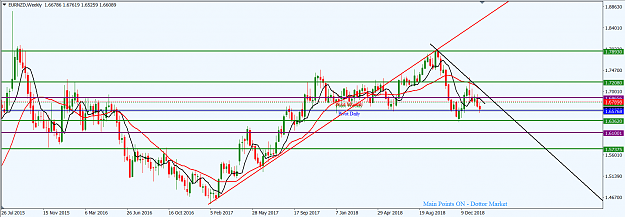
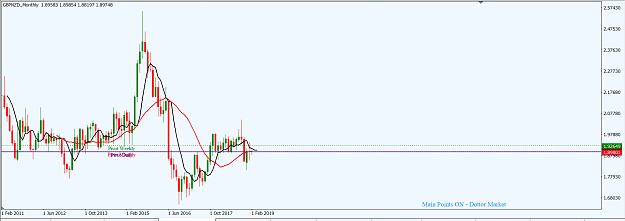
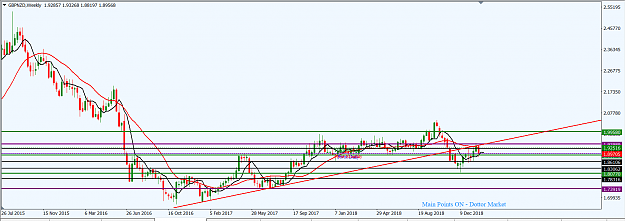
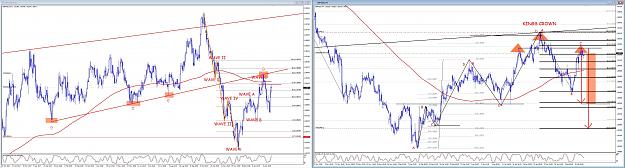
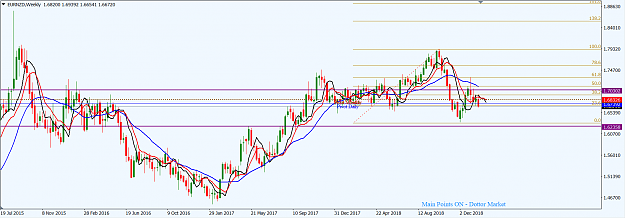
The southward drop of price action in the EURNZD market on the weekly time frame from the high of September 2018 to the low of December 2018 saw a 61.8 Fib tetracement four weeks ago. Since then, bears have manged to make a follow-through and price action is presently located around a support zone (around the 1.66300 area). The technicals are still favorable to bears and the 1.63900 area is a potential target.
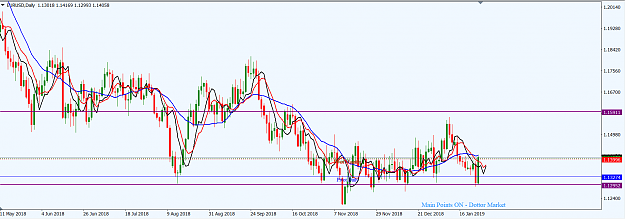
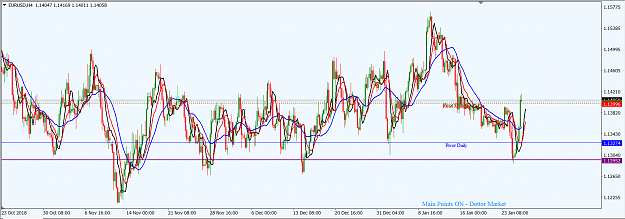
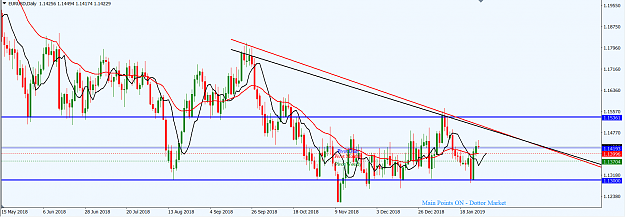
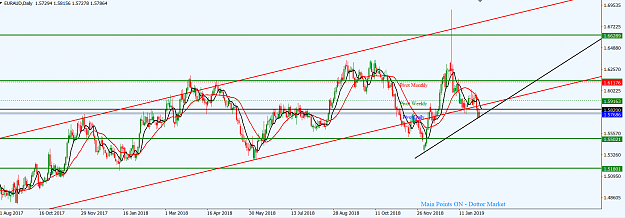
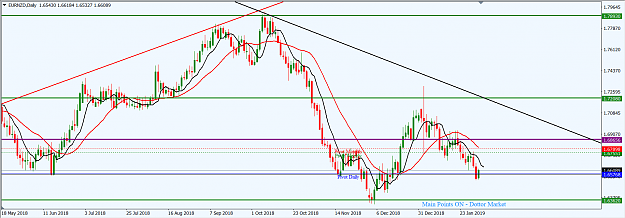
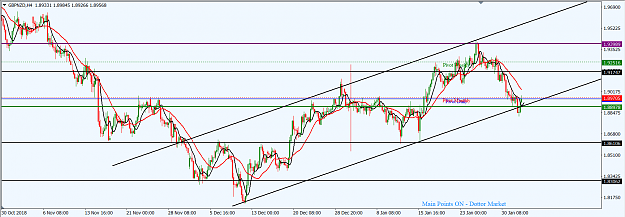
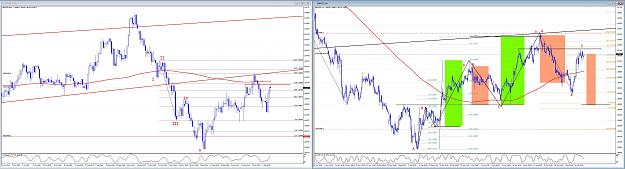
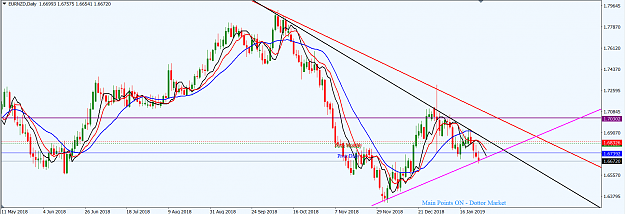
On the daily time frame, price action has retraced to a congestion area and is generally in a consolidation mode. Two descending trendlines, an outer (red) and an inner (black) are potentially acting as resistance. A minor ascending trenline (magenta) is acting as support to recent price action and its break on a daily closing basis is likely to expose the 1.63200 handle. I am bearish EURNZD.
I may be wrong. Trade safe and prosper.
KP
The southward drop of price action in the EURNZD market on the weekly time frame from the high of September 2018 to the low of December 2018 saw a 61.8 Fib tetracement four weeks ago. Since then, bears have manged to make a follow-through and price action is presently located around a support zone (around the 1.66300 area). The technicals are still favorable to bears and the 1.63900 area is a potential target.
Attached Image (click to enlarge)
On the daily time frame, price action has retraced to a congestion area and is generally in a consolidation mode. Two descending trendlines, an outer (red) and an inner (black) are potentially acting as resistance. A minor ascending trenline (magenta) is acting as support to recent price action and its break on a daily closing basis is likely to expose the 1.63200 handle. I am bearish EURNZD.
Attached Image (click to enlarge)
I may be wrong. Trade safe and prosper.
KP
Do your homework, follow the footprints of smart money
3