Weekend puzzle After Friday's push higher, the Russell 2000 has reached a P/E ratio of 115.45, while the dividend yield is 1.33%. One third of the companies comprising the index reported no profit last quarter. Earnings season starts next week. Are the risks to the upside or downside?
Ignored
Government manipulation via FED but what can you do besides to stick with trend and just buy pullbacks. After each pullback markets pull back up again to new highs. This is the current trend and has been over the last 8 years in America. Best tobstick with the flow instead of trying to predict market top. With QE money printing 24/7 off the printing presses there is no tip for this market.
{quote} Government manipulation via FED but what can you do besides to stick with trend and just buy pullbacks. After each pullback markets pull back up again to new highs. This is the current trend and has been over the last 8 years in America. Best tobstick with the flow instead of trying to predict market top. With QE money printing 24/7 off the printing presses there is no tip for this market.
Ignored
Absolutely. At the same time, the markets move in cycles - boom, bust, rinse, repeat - and will continue to do so. By most measures things are out of balance. This will correct itself at some point. When that will happen is, as you say, pointless to try to predict - unless you are using some kind of scientifically verified model for doing so, such as:
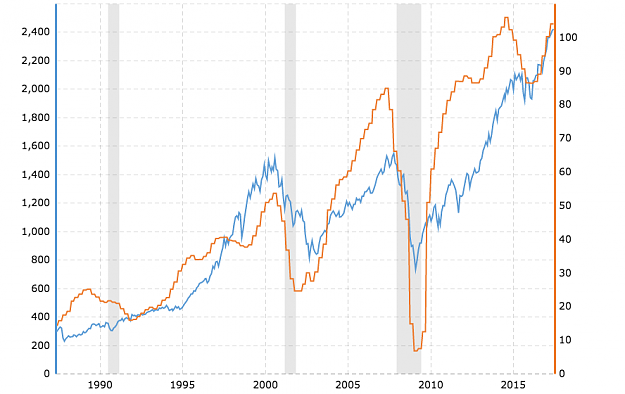
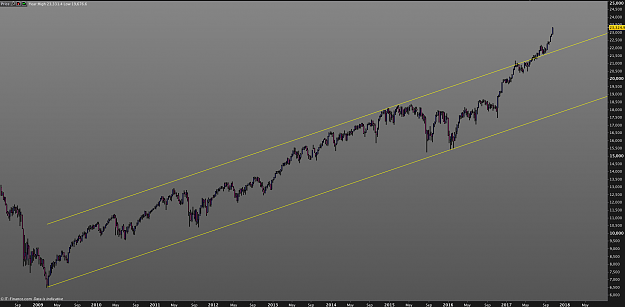
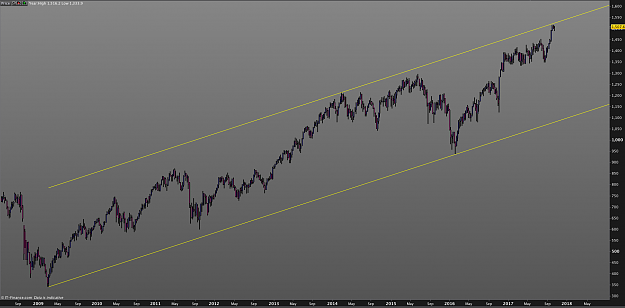
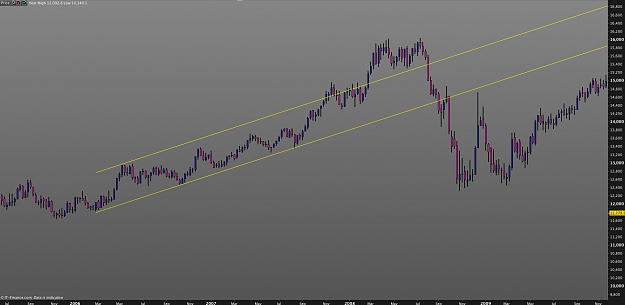
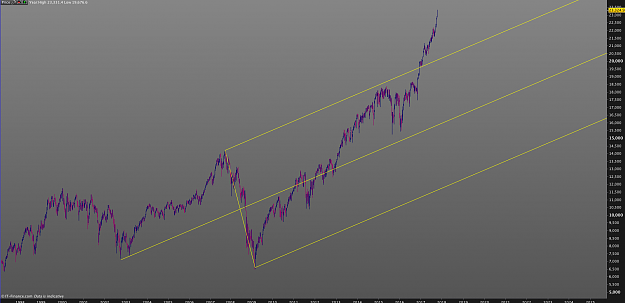
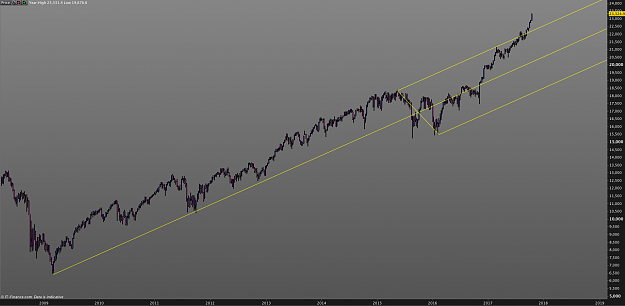
{quote} Where is the evidence supporting them for longer-term charts? Meanwhile, here you have the exact same method applied to the last three market booms. {image} {image}
Ignored
The evidence is in how the median lines capture price.
You're using channels in your charts which differ.
{quote} The evidence is in how the median lines capture price.
Ignored
Yes, but there is so much subjectivity in how you draw pitchforks.
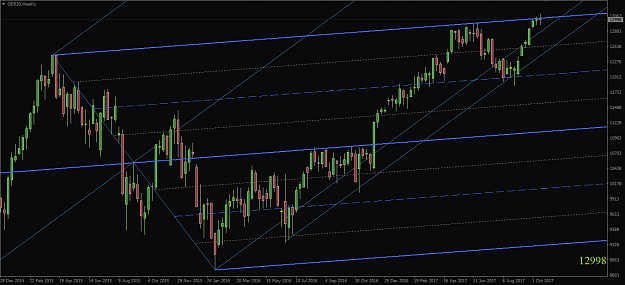
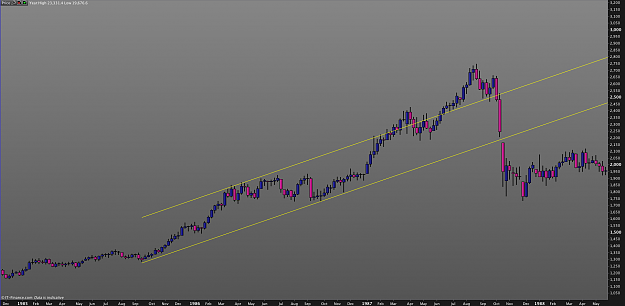
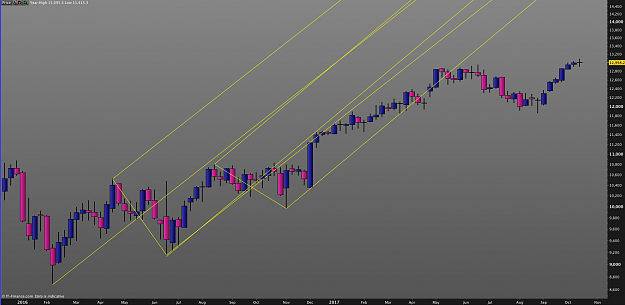
Here's a DAX weekly chart and a couple of pitchforks. Of what use are they? Were they drawn incorrectly? Could pitchforks have been used to shed light on price action from the February 2016 low onwards?
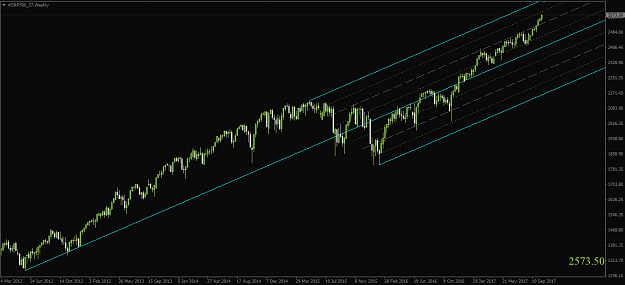
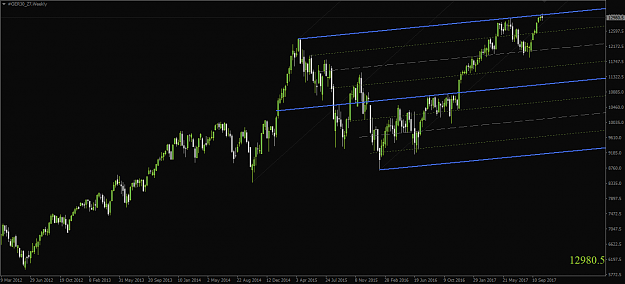
{quote} Yes, but there is so much subjectivity in how you draw pitchforks. Here's a DAX weekly chart and a couple of pitchforks. Of what use are they? Were they drawn incorrectly? Could pitchforks have been used to shed light on price action from the February 2016 low onwards? Then compare it with the channel. {image} {image}
Ignored
How is the DAX chart I posted subjective? It follows price. One must study median lines first to draw them. If you prefer channels, that's your subjective choice.
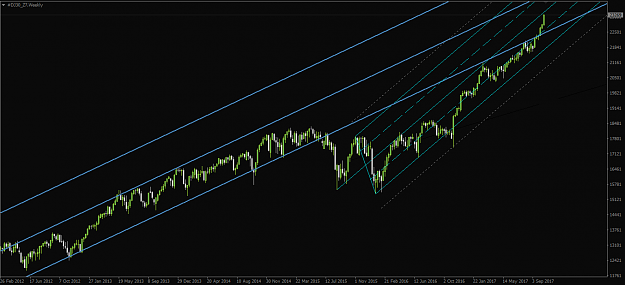
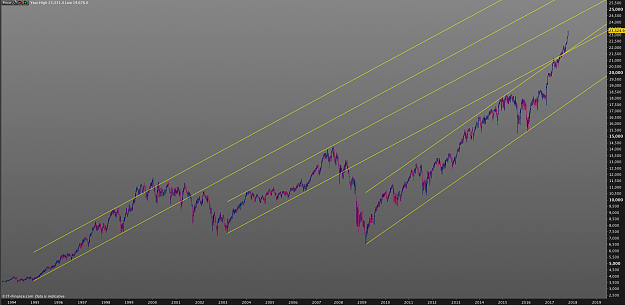
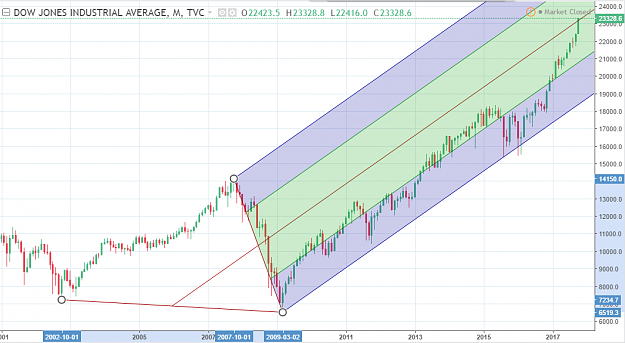
You connect a low before a boom with a low after a correction. That is questionable in my view. A new regime starts in the market after the correction. I've used your technique on the DOW to illustrate my point. See below.
Could you please briefly answer my question from the previous post, i.e. how does your pitchfork shed light on the development after February 2016? It may be obvious to you, but in light of my DOW example, I'm not sure.
Quote
Disliked
One must study median lines first to draw them.
If you prefer channels, that's your subjective choice.
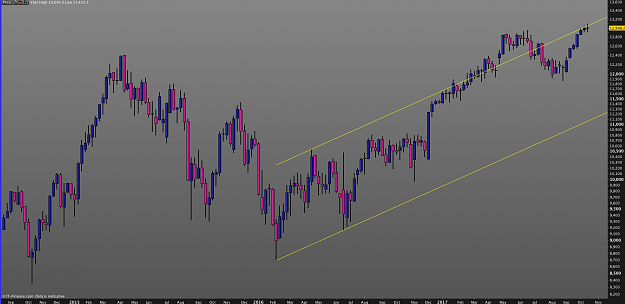
Yes, I have studied pitchforks extensively, and I prefer objective channels to subjective pitchforks. But if you could briefly share, or point to, an objectively testable way of using pitchforks, I would appreciate it.
{quote} How is the DAX chart I posted subjective? It follows price. One must study median lines first to draw them. If you prefer channels, that's your subjective choice. {image}
Ignored
And here is, in my view, the correct way to draw a pitchfork for the long term view of the DOW. It differs from yours above. Care to comment?
{quote} You connect a low before a boom with a low after a correction. That is questionable in my view. A new regime starts in the market after the correction.
Ignored
Perhaps this wider perspective might clarify.
DAX wkly
{quote} Yes, I have studied pitchforks extensively, and I prefer objective channels to subjective pitchforks. But if you could briefly share, or point to, an objectively testable way of using pitchforks, I would appreciate it. {image}
Ignored
There are variations in projections of median lines.
DowJones Monthly
{quote} Perhaps this wider perspective might clarify. DAX wkly {image}
Ignored
Well, you've removed the pitchfork I referred to I guess that says something.
As to your method of choosing the three points - unless you formulate a method with bakctested results - looks very much like subjective curve-fitting. Differently put, you pick the points to get the result you want instead of picking the points by a method.