- Search Forex Factory
- 67 Results
- lascavel replied Feb 2, 2011
Tradeguider style templates — Hi Malc, Intel, HG, polomine, pete & all... Long time no see.. I thought i like to share this templates here for those who like to emulate Tradeguider color scheme. These are created by my colleague in the office ...
vsa with Malcolm
- lascavel replied Dec 16, 2010
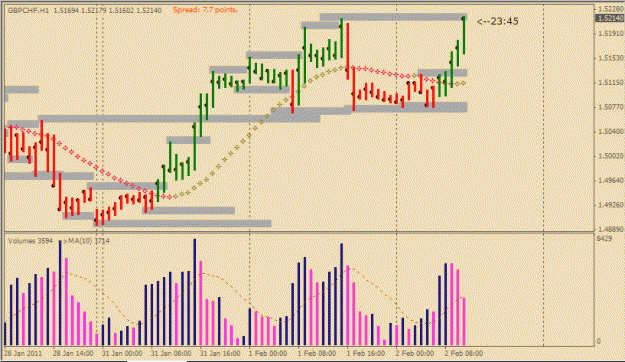
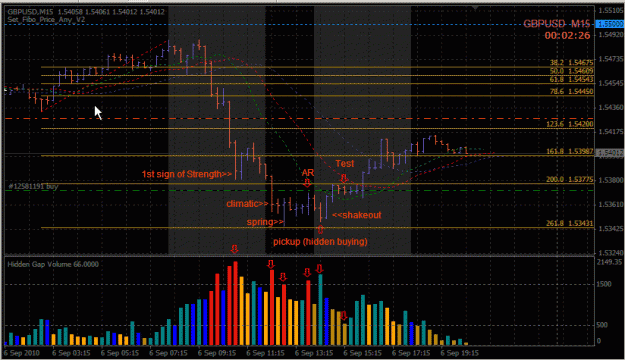
methodical error in analysis! — Hi Jaboo, nice pips I'wd like to point out some methodical error in your analysis: The area in in which you indicated "area of supply" on the left of you screen, this is actually the 1st sign of strength or a ...
vsa with Malcolm
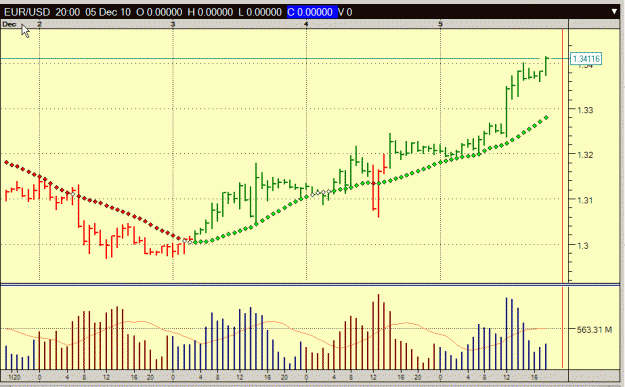
- lascavel replied Dec 5, 2010
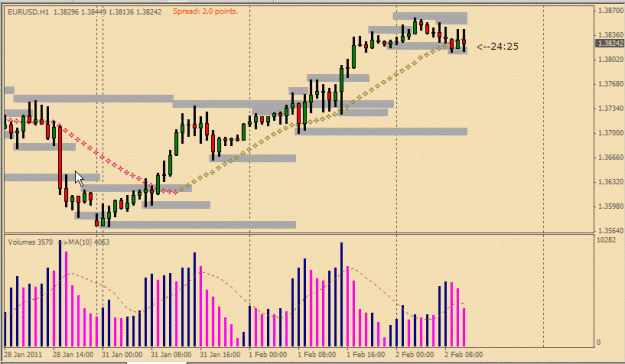
TG diamonds = SMA — TG diamonds is actually SMA. Attache is the indicator if you still wants it. FYI for comparison: image image file Cheers!
vsa with Malcolm
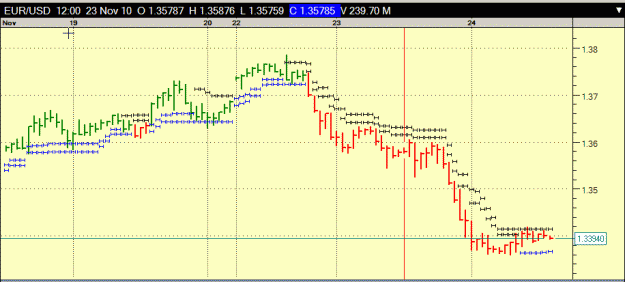
- lascavel replied Nov 24, 2010
Hi Mima, Polomine. It is just a form of ATR stops, here is a close approximate comparison. image image
vsa with Malcolm
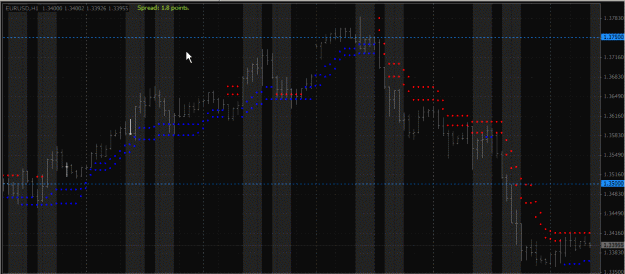
- lascavel replied Nov 23, 2010
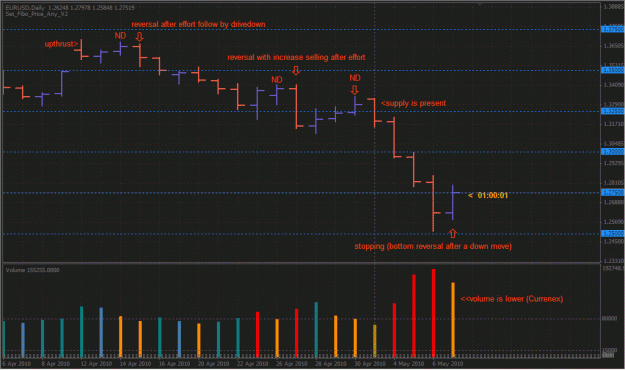
Yes, it have me scratching my head for awhile after i saw these suspicious looking supply bars which is a form of hidden selling as i was holding on to a possible accumulation plan earlier for euro. It was rather evident in GBP though in which I ...
vsa with Malcolm
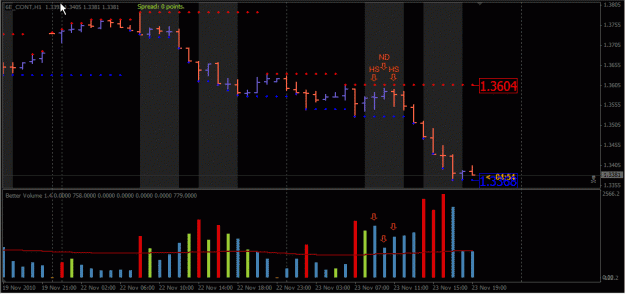
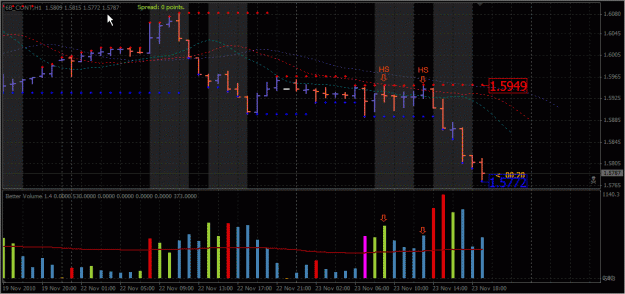
- lascavel replied Nov 23, 2010
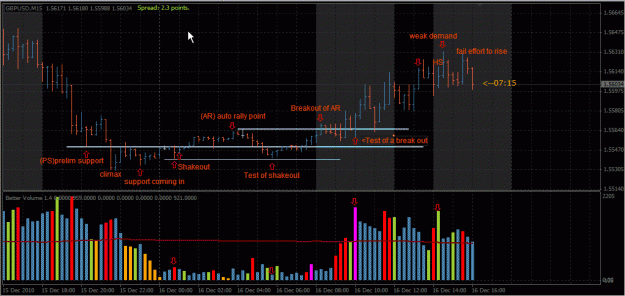
Just an update: FYI, Basic test has appear at PS level, this should confirm the accumulation. Hopefully a test in a rising market could provide an entry near or just b4 the resistance zone around auto rally pt. (there is this suspicious supply ...
vsa with Malcolm
- lascavel replied Nov 23, 2010
Wyckoff accumulation wave! — Hi Polomine, Intel, long time no see.. That is where i think Wyckoff wave may help, as a possible accumulation maybe taking place right now... From here a test back to PS level would be helpful to further ascertain ...
vsa with Malcolm
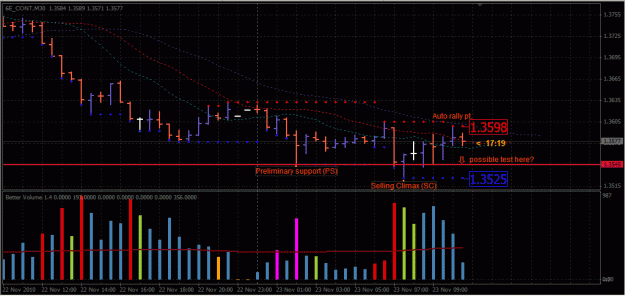
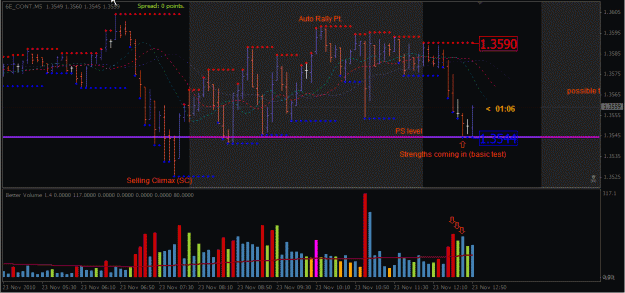
- lascavel replied Oct 21, 2010
test of previous supply area! — Gooday Indiana & DMA, I know is kind of late now but this is the test you guys should be looking for as EU was clearly re accumulating after we have witness that climax & the 1st test. In fact Indiana's last bar ...
vsa with Malcolm
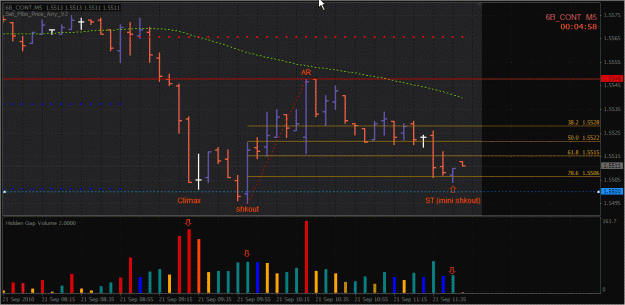
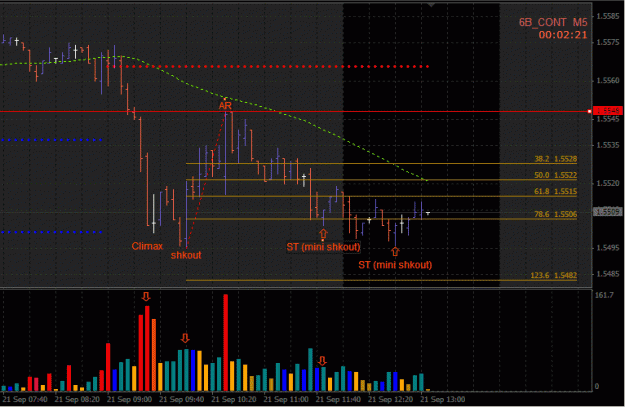
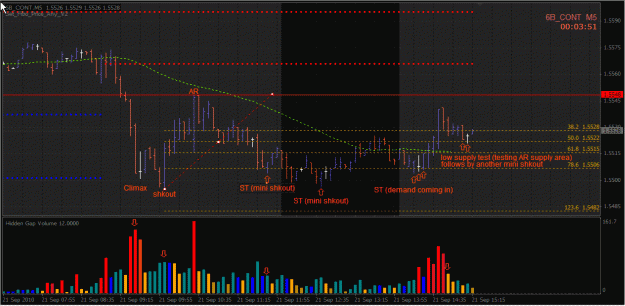
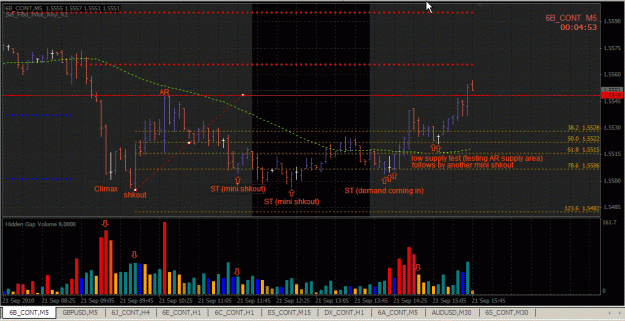
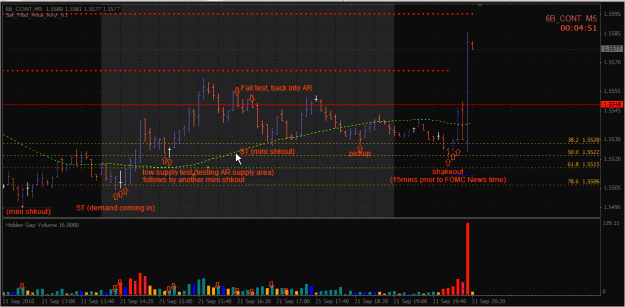
- lascavel replied Sep 21, 2010
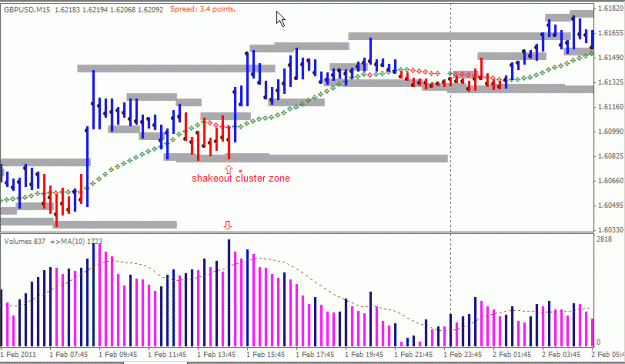
GU 5mins test — After a huge spread down move, we see climatic action on GU. Here is a 5mins view as per Wyckoff schematics, latest feed showing a secondary test of a form like a shakeout. Is call a mini-shakeout at around 79% retrace level of ...
VSA learching

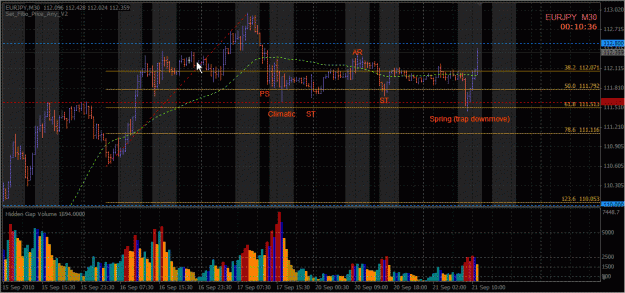
- lascavel replied Sep 21, 2010
EJ Wyckoff Schematics example. — Here is EJ Wyckoff Schematics example showing EJ ranging market since Climax 2 days ago in which it goes into a re-accumulation wave... & the classic "Spring" on the right as shown. Note the ST levels occurs ...
VSA learching
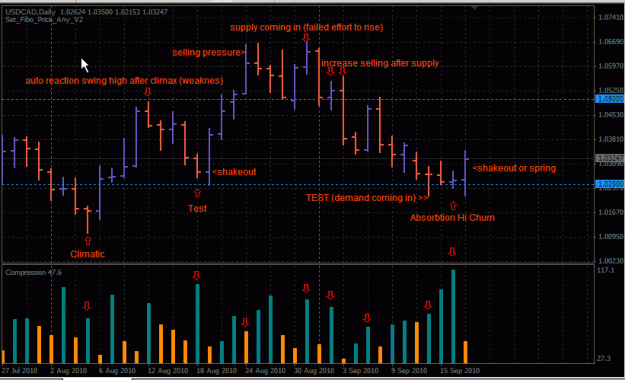
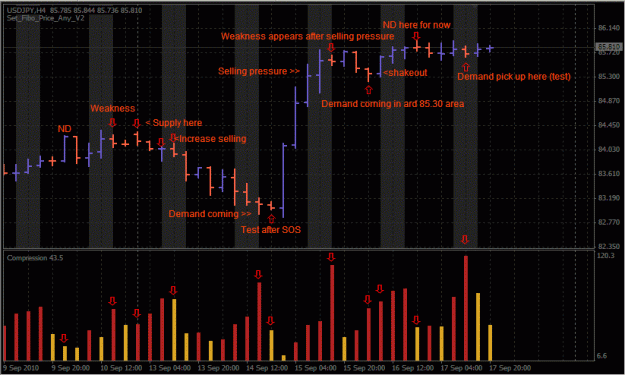
- lascavel replied Sep 19, 2010
USDCAD compression! — Just one more to add to the above post, this hypothetical read is for USDCAD Daily chart. As it seems USDCAD could be on a testing spree on 1.02500 level, as per Wyckoff Schematics on accumulation..... image
VSA learching
- lascavel replied Sep 18, 2010
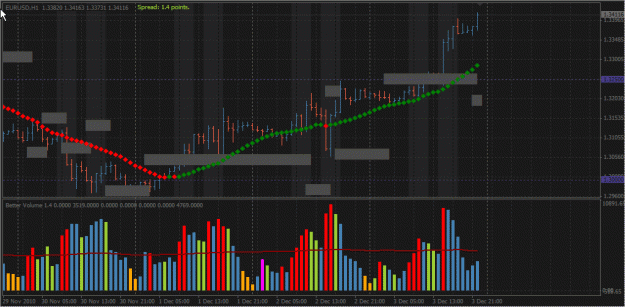
Good stuff Rob,I have a similar indicator that i use in Trade-station previously. Infact Compression like hi vol + small range bar & in Bettervolume i think they call it high Churn bars or something. Anyway using a 4hr chart of UJ. This is just an ...
VSA learching
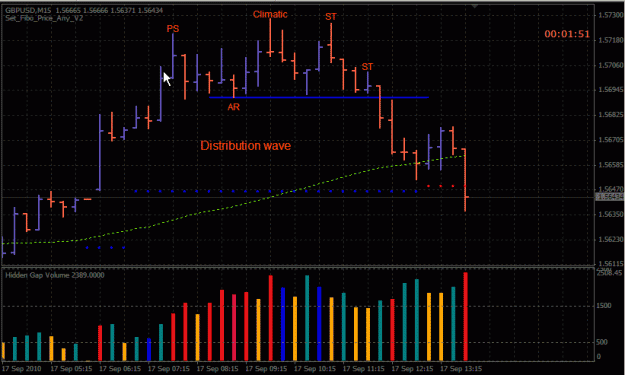
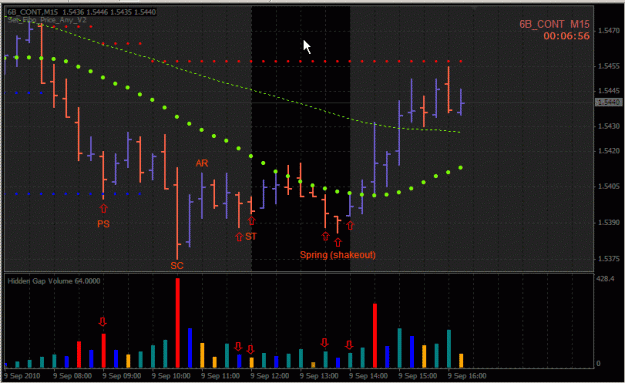
- lascavel replied Sep 17, 2010
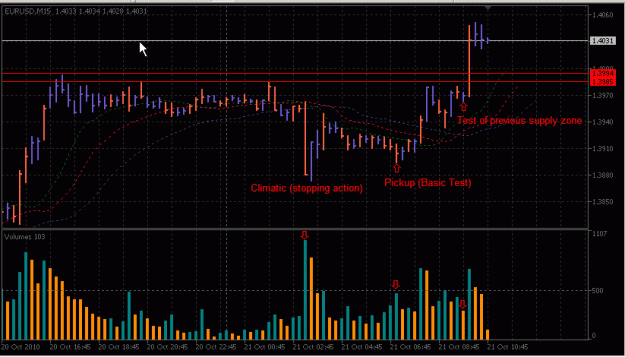
GU on 15mins distribution — Here is a illustration of GU 15mins distribution wave sequence per Wyckoff Schematic. Errata, the AR should be the swing low after the Climatic sequence..not after the PS as shown... image
VSA learching
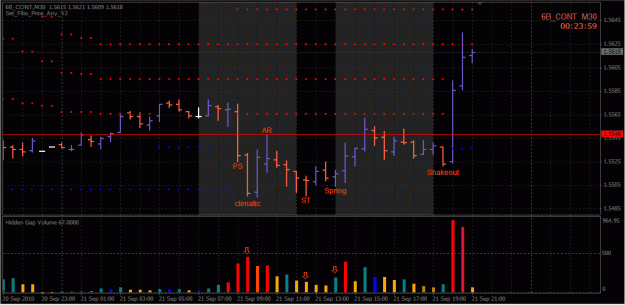
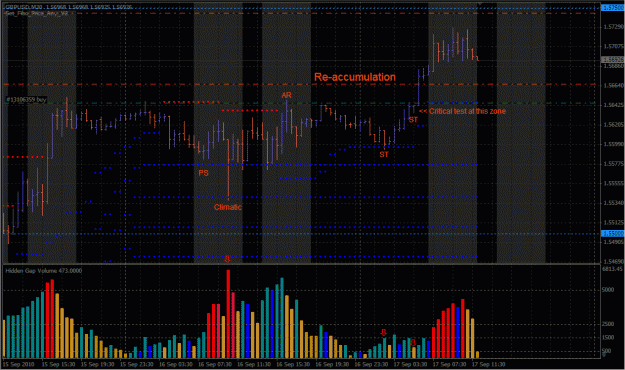
- lascavel replied Sep 17, 2010
GU 30mins Wyckoff Scematics — Hi All, Here is an example of a Wyckoff Schematics for GU of pass 2 days of re-accumulation, showing a critical test in the supply area prior to the upmove after a shakeout yesterday which form the basis of the ...
VSA learching
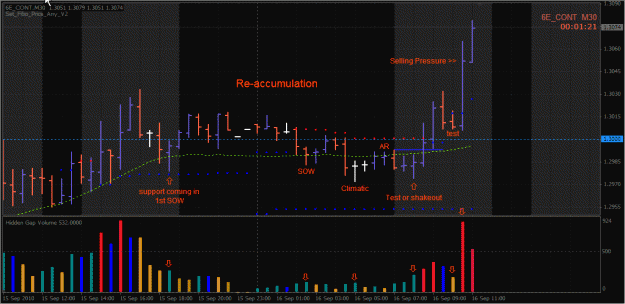
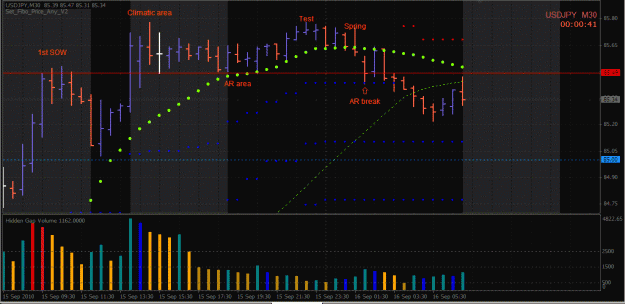
- lascavel replied Sep 16, 2010
EURO futures example — Here is another example of VSA mapping it to Wyckoff Schematics. edit: note that SOW here should be SOS instead as pointed out by HG below. Sorry for the typo. image
VSA learching
- lascavel replied Sep 16, 2010
Again! Wyckoff Scematics — Good day Gesek, Just to illustrate the Wyckoff Scematics framework which have implication on your VSA analysis. Chart of UJ. UJ could be building up for a re accumulation phase after a major shakeout yesterday due to ...
VSA learching
- lascavel replied Sep 9, 2010
Wyckoff schematics — Hi Gesek, I would like to suggest that Learchers read the following documents too by Hank Prudent.. url It details the phases how "price structure" are played out in wyckoff analysis. This price structure are crucial in ...
VSA learching
- lascavel replied Sep 6, 2010
GU on 15mins — Hi all, Just a quick grab on GU trade After the drop from London session, GU have provided a opportunity to counter trade the up move with the presence of climatic action & follow through. (Note how nicely the price bounce off ...
vsa with Malcolm
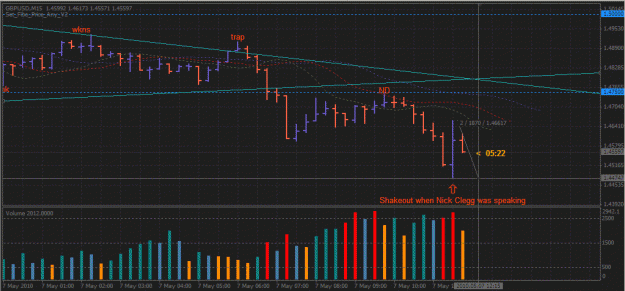
- lascavel replied May 8, 2010
Hi V_2008 Just to add to malcolmb14's replied to you. My data source (supposedly from Currenex) is showing a lower vol bar. But in your case is higher vol. image In any case both are of stopping volume type. Or in VSA terms is a bottom reversal ...
Trade Using VSA (Volume Spread Analysis)
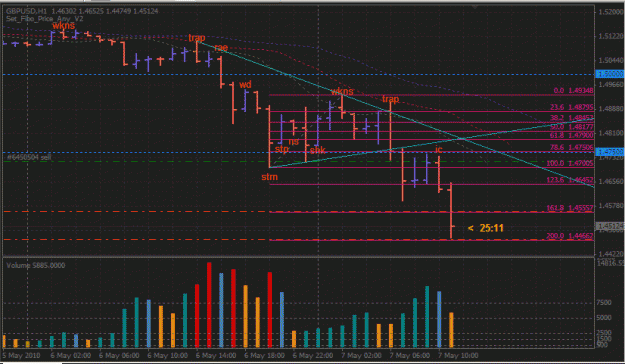
- lascavel replied May 7, 2010
GU trades — How all, just to share my lucky trade. Scary day for any pair with at these times with ATR hitting very high. Here was my entry after the trap-upmoved as indicated. Just after the break of the support trend line. image For those ...
Trade Using VSA (Volume Spread Analysis)