• Home
  • Forums
  • Trades
  • News
  • Calendar
  • Market
  • Brokers
  • Login
  • Join
  • User/Email: Password:
  • 8:37am
Menu
  • Forums
  • Trades
  • News
  • Calendar
  • Market
  • Brokers
  • Login
  • Join
  • 8:37am
Sister Sites
  • Metals Mine
  • Energy EXCH
  • Crypto Craft

Options

Bookmark Thread

First Page First Unread Last Page Last Post

Print Thread

Similar Threads

VSA-divergence trading 187 replies

How to Blow $200 account using VSA--- 594 replies

VSA Journal 57 replies

VSA broker history change datas 11 replies

  • Interactive Trading
  • /
  • Reply to Thread
  • Subscribe
  • 12,277
Attachments: vsa with Malcolm
Exit Attachments
Tags: vsa with Malcolm
Cancel

vsa with Malcolm

  • Last Post
  •  
  • 1 395396Page 397398399 1799
  • 1 Page 397 1799
  •  
  • Post #7,921
  • Quote
  • Dec 15, 2010 5:02pm Dec 15, 2010 5:02pm
  •  McL
  • | Joined Jun 2010 | Status: Member | 31 Posts
Quoting Intel
Disliked
The average one wont tell him if the current is lower than the lowest bar, just the average of the 2.

There is a projected volume indi for ensign but it doesnt have the < than prev 2 function.

What do you think McL?
Ignored
I don't know ensign, but in that case in MT4 or JForex I would compute min of two bars (dMinVol), volume or projected volume (dVol) for bar (of course for current bar it will change in time) and draw red dot if dVol < dMinVol and green if opposite
 
 
  • Post #7,922
  • Quote
  • Dec 15, 2010 5:34pm Dec 15, 2010 5:34pm
  •  SimpleDev
  • Joined Apr 2010 | Status: Retired | 575 Posts
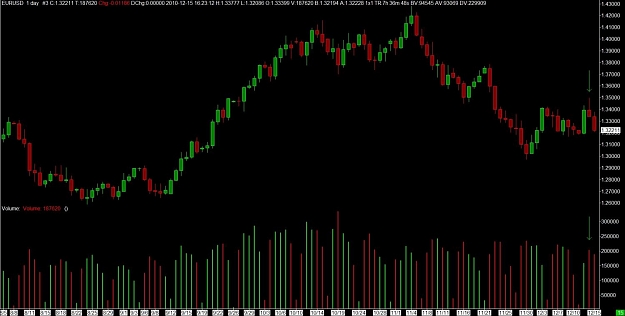
I see 1.27 in the near future...
Attached Image (click to enlarge)
Click to Enlarge

Name: chart.jpg
Size: 100 KB
 
 
  • Post #7,923
  • Quote
  • Dec 15, 2010 6:35pm Dec 15, 2010 6:35pm
  •  Intel
  • Joined Dec 2009 | Status: Member | 2,367 Posts
Quoting HiddenGap
Disliked
I'm looking for some help with a DYO for Ensign. I need to figure out how to paint volume less than the previous two. Can anybody help?
Ignored
Try the attached. See what happens
Attached File(s)
File Type: doc Ok HG.doc   40 KB | 372 downloads
 
 
  • Post #7,924
  • Quote
  • Edited 11:38pm Dec 15, 2010 11:10pm | Edited 11:38pm
  •  jaboo
  • | Joined Dec 2009 | Status: Ray Comfort is....the banana man | 236 Posts
I think SM started distributing around bar A.

A - Ulta high volume. Indication that supply is hitting the market.
B - High volume, closing off the highs, more selling.
C - No demand going up in to bar B area.
D - Decent volume, NARROW spread. Herd is buying while SM is selling.
E - Weakness confirmed by this bar.
F - Narrow spread, high volume. People are rushing in to catch this breakout while SM is enjoying selling to the herd.
G - Decreasing volume. Closing off the highs. NO Demand here.

Distribution completed.

I think .5347 might be the next stop.

Also take a look at the weekly chart. Weakness definitely there.
Attached Image (click to enlarge)
Click to Enlarge

Name: 12-15-2010 10-54-36 PM.png
Size: 56 KB
 
 
  • Post #7,925
  • Quote
  • Dec 16, 2010 2:47am Dec 16, 2010 2:47am
  •  Intel
  • Joined Dec 2009 | Status: Member | 2,367 Posts
Quoting jaboo
Disliked
I think SM started distributing around bar A.

A - Ulta high volume. Indication that supply is hitting the market.
B - High volume, closing off the highs, more selling.
C - No demand going up in to bar B area.
D - Decent volume, NARROW spread. Herd is buying while SM is selling.
E - Weakness confirmed by this bar.
F - Narrow spread, high volume. People are rushing in to catch this breakout while SM is enjoying selling to the herd.
G - Decreasing volume. Closing off the highs. NO Demand here.

Distribution completed.

I think .5347 might...
Ignored
Just go carefull jaboo. I think we may see a retrace up to the 5660 area.
 
 
  • Post #7,926
  • Quote
  • Dec 16, 2010 2:59am Dec 16, 2010 2:59am
  •  jaboo
  • | Joined Dec 2009 | Status: Ray Comfort is....the banana man | 236 Posts
Quoting Intel
Disliked
Just go carefull jaboo. I think we may see a retrace up to the 5660 area.
Ignored
i dont disagree with a retrace. actually looking for, at the moment, a break .5572.

.5527 showed some bullishness. though on the 15 minutes that no demand bar in the previous area of high vol doesnt look promising to the up side.

Will wait and see.
 
 
  • Post #7,927
  • Quote
  • Dec 16, 2010 4:36am Dec 16, 2010 4:36am
  •  PrymeTyme
  • Joined Oct 2009 | Status: 5%er Wannabe | 769 Posts
Quoting jaboo
Disliked
I think SM started distributing around bar A.

A - Ulta high volume. Indication that supply is hitting the market.
B - High volume, closing off the highs, more selling.
C - No demand going up in to bar B area.
D - Decent volume, NARROW spread. Herd is buying while SM is selling.
E - Weakness confirmed by this bar.
F - Narrow spread, high volume. People are rushing in to catch this breakout while SM is enjoying selling to the herd.
G - Decreasing volume. Closing off the highs. NO Demand here.

Distribution completed.

I think...
Ignored

To mee GU is In accumulation ATM ... its strenghten.. check
Attached Image(s) (click to enlarge)
Click to Enlarge

Name: gudaily.png
Size: 65 KB
Click to Enlarge

Name: gudailyh4.gif
Size: 69 KB
Click to Enlarge

Name: guH1.png
Size: 67 KB
 
 
  • Post #7,928
  • Quote
  • Dec 16, 2010 4:56am Dec 16, 2010 4:56am
  •  jaboo
  • | Joined Dec 2009 | Status: Ray Comfort is....the banana man | 236 Posts
Quoting PrymeTyme
Disliked
To mee GU is In accumulation ATM ... its strenghten.. check
Ignored
Nice charts.

I'm not saying thats not possible. I was just explaining the down move.

Im currently long from .5570 with S/L at B/E. my TP is at .5650.

I still think we might go down a bit more though. Definitely saw strength at the .5525 which i have a strong support line at. Will look for weakness to short.

though if you believe they are accumulating, do you think it's all up from here? Im not convinced.
 
 
  • Post #7,929
  • Quote
  • Dec 16, 2010 5:08am Dec 16, 2010 5:08am
  •  PrymeTyme
  • Joined Oct 2009 | Status: 5%er Wannabe | 769 Posts
Quoting jaboo
Disliked
Nice charts.

I'm not saying thats not possible. I was just explaining the down move.

Im currently long from .5570 with S/L at B/E. my TP is at .5650.

I still think we might go down a bit more though. Definitely saw strength at the .5525 which i have a strong support line at. Will look for weakness to short.

though if you believe they are accumulating, do you think it's all up from here? Im not convinced.
Ignored
yepp i do think its going up from here now .. i even think u willl get your TP hit
by tomorrow...

take care .. gotta go now
 
 
  • Post #7,930
  • Quote
  • Dec 16, 2010 6:40am Dec 16, 2010 6:40am
  •  jaboo
  • | Joined Dec 2009 | Status: Ray Comfort is....the banana man | 236 Posts
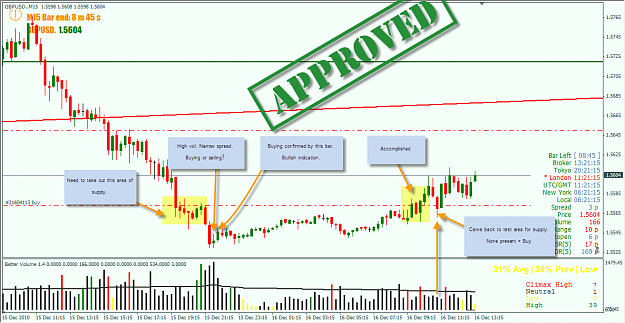
VSA set up for long on the GU.

at +52. S/L at BE.
Attached Image (click to enlarge)
Click to Enlarge

Name: 12-16-2010 6-21-23 AM.png
Size: 112 KB
 
 
  • Post #7,931
  • Quote
  • Dec 16, 2010 9:11am Dec 16, 2010 9:11am
  •  000dragan
  • | Membership Revoked | Joined Sep 2010 | 2,072 Posts
am i right?
http://img692.imageshack.us/img692/3861/chstty278.gif

does anyone wanna have a guess where this is going>?

http://img684.imageshack.us/img684/3861/chstty278.gif

im hoping up,cos im in a usdjpy short

night evryone!
 
 
  • Post #7,932
  • Quote
  • Dec 16, 2010 9:15am Dec 16, 2010 9:15am
  •  lascavel
  • | Joined Oct 2008 | Status: Member | 122 Posts
Quoting jaboo
Disliked
VSA set up for long on the GU.

at +52. S/L at BE.
Ignored
Hi Jaboo, nice pips

I'wd like to point out some methodical error in your analysis:

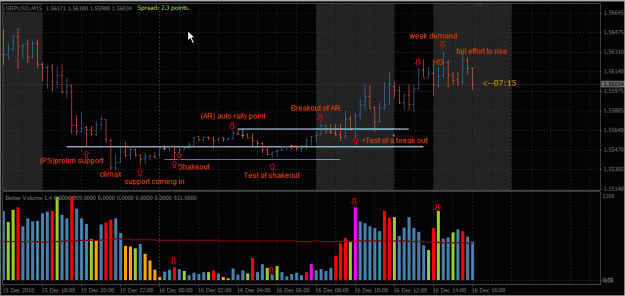
The area in in which you indicated "area of supply" on the left of you screen, this is actually the 1st sign of strength or a form of preliminary support (PS) as per wyckoff analysis

The area which you'd point out to be test of previous supply, i think it should be a form of test of previous support rather, namely the PS level

IN addition i have also include in my chart some essential test that have not indicate...

hope is helpful

Cheers
Las

Attached Image (click to enlarge)
Click to Enlarge

Name: ScreenHunter_04 Dec. 16 22.07.gif
Size: 34 KB
 
 
  • Post #7,933
  • Quote
  • Dec 16, 2010 9:50am Dec 16, 2010 9:50am
  •  jaboo
  • | Joined Dec 2009 | Status: Ray Comfort is....the banana man | 236 Posts
Quoting lascavel
Disliked
Hi Jaboo, nice pips

I'wd like to point out some methodical error in your analysis:

The area in in which you indicated "area of supply" on the left of you screen, this is actually the 1st sign of strength or a form of preliminary support (PS) as per wyckoff analysis

The area which you'd point out to be test of previous supply, i think it should be a form of test of previous support rather, namely the PS level

IN addition i have also include in my chart some essential test that have not indicate...

hope is helpful

Cheers
Las

Attachment 599768...
Ignored
hey mate,

youre absolutely right. I think i just did a bad job of articulating what i meant lol. used the wrong terms.

that of course was a sign of strength. the reasoning i was looking for a long but i wanted to test the suply in that area.
 
 
  • Post #7,934
  • Quote
  • Dec 16, 2010 9:51am Dec 16, 2010 9:51am
  •  Sonofsin5
  • Joined Jan 2009 | Status: Fading the specs | 1,374 Posts
Wow I hope we get some more movement in the Eur soon or I may be forced to watch cnbc or something, at least that keeps me awake.
 
 
  • Post #7,935
  • Quote
  • Dec 16, 2010 10:11am Dec 16, 2010 10:11am
  •  Sonofsin5
  • Joined Jan 2009 | Status: Fading the specs | 1,374 Posts
Quoting Sonofsin5
Disliked
Wow I hope we get some more movement in the Eur soon or I may be forced to watch cnbc or something, at least that keeps me awake.
Ignored
lol, they read my post, go euro
 
 
  • Post #7,936
  • Quote
  • Dec 16, 2010 10:20am Dec 16, 2010 10:20am
  •  malcolmb14
  • Joined Apr 2007 | Status: HARD SHYT SCUBA TRADER | 20,883 Posts
Quoting PrymeTyme
Disliked
To mee GU is In accumulation ATM ... its strenghten.. check
Ignored

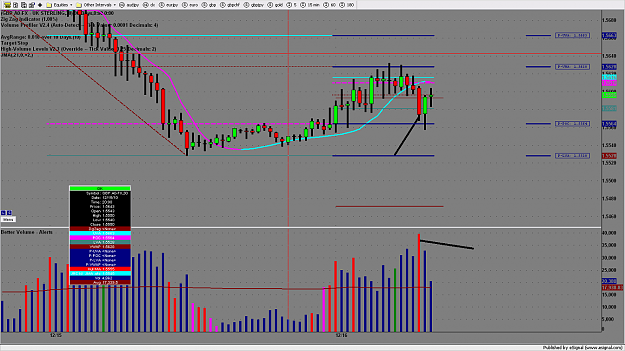
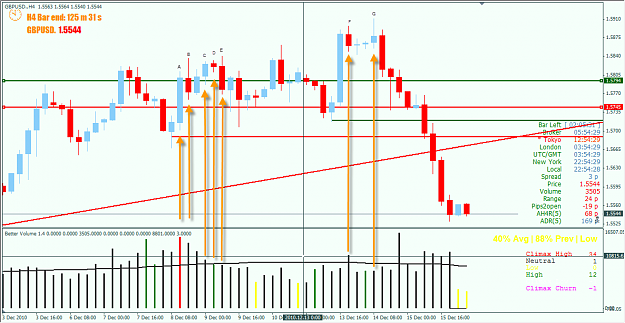
thinking the opposite myself

even this small bear flag got hit by sellers

Attached Image (click to enlarge)
Click to Enlarge

Name: chart3146.gif102.png
Size: 165 KB
Blogging daily now at www.volume.zone
 
 
  • Post #7,937
  • Quote
  • Dec 16, 2010 10:21am Dec 16, 2010 10:21am
  •  piotr-fx
  • | Joined Dec 2010 | Status: finally on the correct path | 158 Posts
Quoting Intel
Disliked
Thanks but that wasn't one of my charts, I just annotated someone elses.

Foxy is right. Look for Master The Markets by Tom Williams, it is widely available here at FF (Forex Factory). If you look in the attachments folder in the top right of this thread, it will probably be in there somewhere(sorry I cant think of where it is exactly off hand). MTM is where most of the abbreviations begin.

a few common ones are :-

SO shakeout
UT up thrust
ND no demand
NS no supply
NSP no selling pressure
NBP no buying pressure
HV high volume
LV low volume
UHV...
Ignored
thanks Intel,
I am already in progress with reading MTM and all I was able to find

I have another question: is here anybody who uses VSA with mid/long term trading rather than intraday? I am technical analyst and I do not trade intraday and as for now I can see that volume spread seems very, very interesting tool to combine with TA. thanks again
 
 
  • Post #7,938
  • Quote
  • Dec 16, 2010 10:56am Dec 16, 2010 10:56am
  •  juhanimi
  • Joined Feb 2009 | Status: Member | 2,293 Posts
Quoting malcolmb14
Disliked
thinking the opposite myself

even this small bear flag got hit by sellers

Attachment 599813
Ignored
There was NS in H1 few hours ago, so maybe this downmove is Kansas City Shuffle?
 
 
  • Post #7,939
  • Quote
  • Dec 16, 2010 11:13am Dec 16, 2010 11:13am
  •  juhanimi
  • Joined Feb 2009 | Status: Member | 2,293 Posts
Quoting piotr-fx
Disliked
I have another question: is here anybody who uses VSA with mid/long term trading rather than intraday?
Ignored
H1 is good with mid/long term trading.
 
 
  • Post #7,940
  • Quote
  • Dec 16, 2010 11:19am Dec 16, 2010 11:19am
  •  malcolmb14
  • Joined Apr 2007 | Status: HARD SHYT SCUBA TRADER | 20,883 Posts
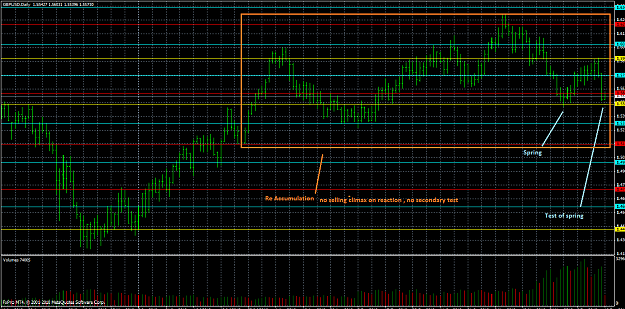
potential stopping vol 30 min gu now...

Attached Image (click to enlarge)
Click to Enlarge

Name: chart3146.gif106.png
Size: 154 KB
Blogging daily now at www.volume.zone
 
 
  • Interactive Trading
  • /
  • vsa with Malcolm
  • Reply to Thread
    • 1 395396Page 397398399 1799
    • 1 Page 397 1799
1 member viewing:
Frag8383
  • More
Top of Page
  • Facebook
  • Twitter
About FF
  • Mission
  • Products
  • User Guide
  • Media Kit
  • Blog
  • Contact
FF Products
  • Forums
  • Trades
  • Calendar
  • News
  • Market
  • Brokers
  • Trade Explorer
FF Website
  • Homepage
  • Search
  • Members
  • Report a Bug
Follow FF
  • Facebook
  • Twitter

FF Sister Sites:

  • Metals Mine
  • Energy EXCH
  • Crypto Craft

Forex Factory® is a brand of Fair Economy, Inc.

Terms of Service / ©2023