- Search Forex Factory
- 67 Results
-
 Spinner replied Sep 7, 2013
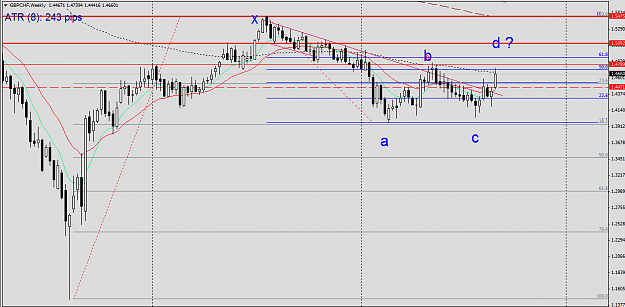
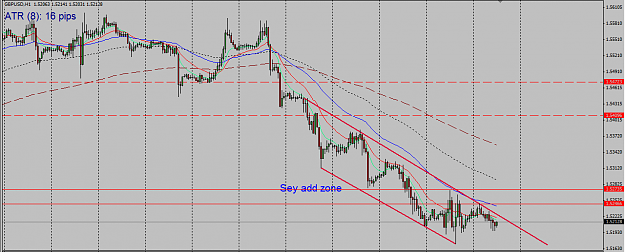
Great! I assume that the red dashed line at the bottom is the TP? What about this gbp chf charts? Weekly candle at the 50%
My view journal
- Spinner replied Aug 30, 2013
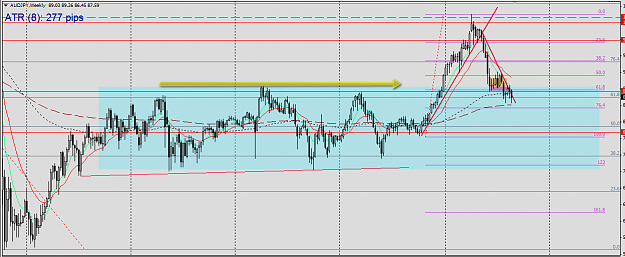
I also see in the weekly a retest of the lighr blue rectangle, so planning to be long when/if it decides to break 89 s/r. At 90 it would create a double bottom. image
My view journal
- Spinner replied May 16, 2013
That a question with a trick in it?
My view journal I draw them as i feel they reflect the trend best and will give me info when they get broken. Mostly I don't s=use the first highs in a downtrend or lows in an uptrend, cause they always seem to go a bit too ...
- Spinner replied May 10, 2013
your 23 can also be the 38 of next more up. Same place. And high of July 08
My view journal
- Spinner replied Sep 28, 2011
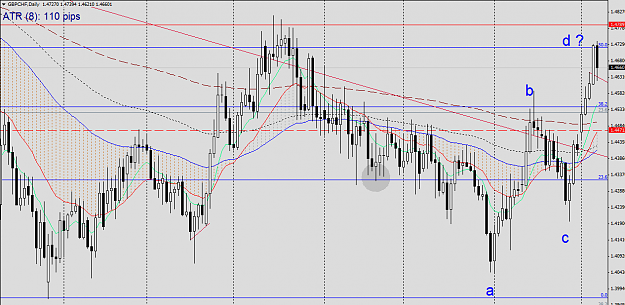
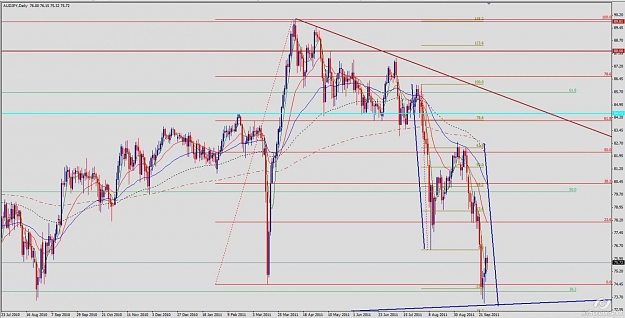
Usd/jpy is being a bit stubborn. got some pips long yesterday but today bak down. COT has less long yen traders every week.... we'll see. as for a/j we have the rate differential in our favour. Here's my daily chart
My view journal
- Spinner replied Sep 19, 2011
eur — Kinda looks like if it breaks this point it will tank
My view journal
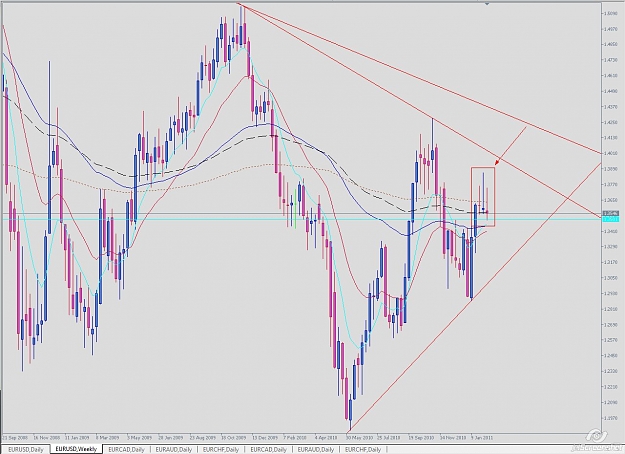
- Spinner replied Jun 9, 2011
Just to make simple things a bit more complicated, I have added two fibos and a couple of lines. For now , price is not quite ready to pass the 50% and previously mentioned resistance. See where it closes.
Strat's Long Term Stress Free Trading

- Spinner replied May 28, 2011
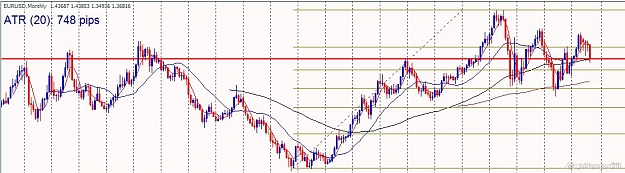
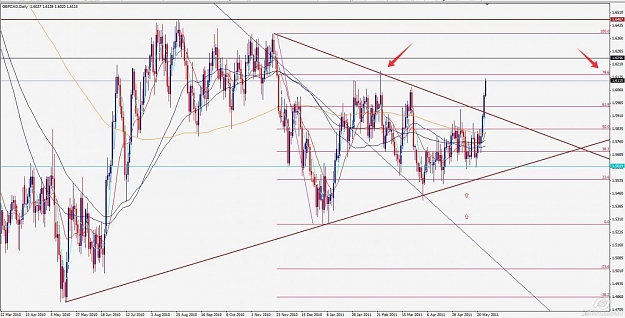
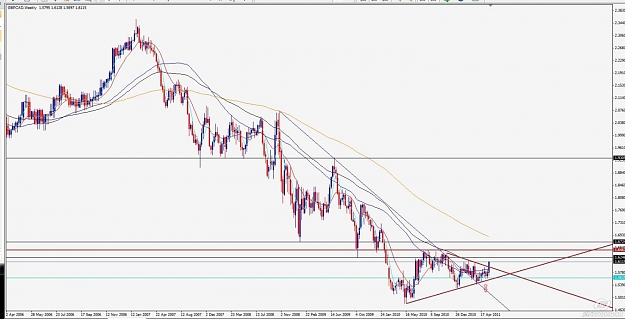
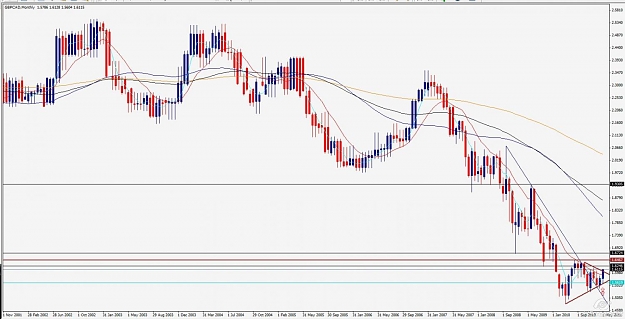
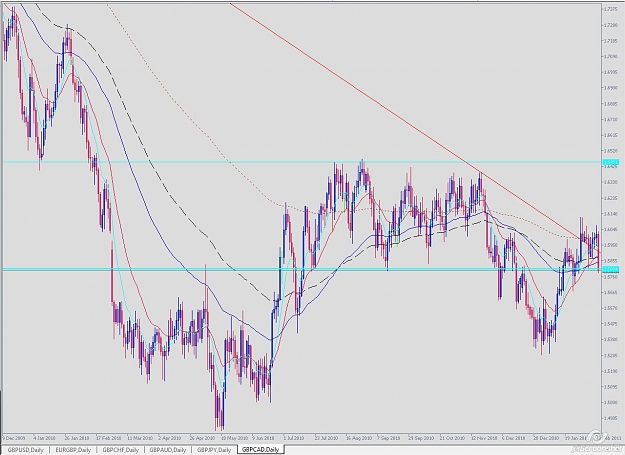
GBP CAD — On to look at Monthly far away from the emas. trend down. Weekly bullish bar. 100 still pointing down but not so the 50. Daily playing between fibos and broke the wedge. Emas bunched together starting to point up. I think that this ...
Strat's Long Term Stress Free Trading
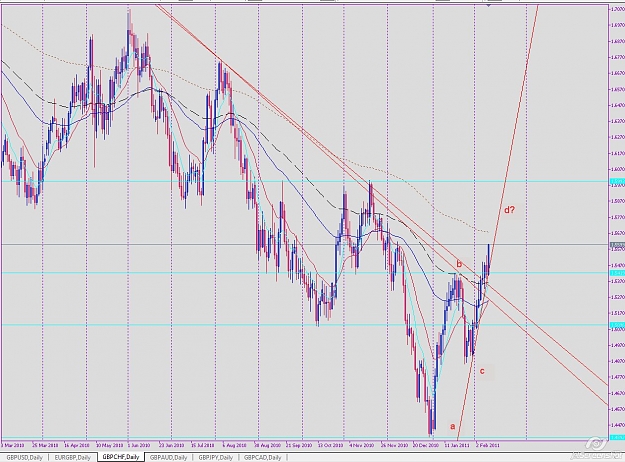
- Spinner replied Feb 10, 2011
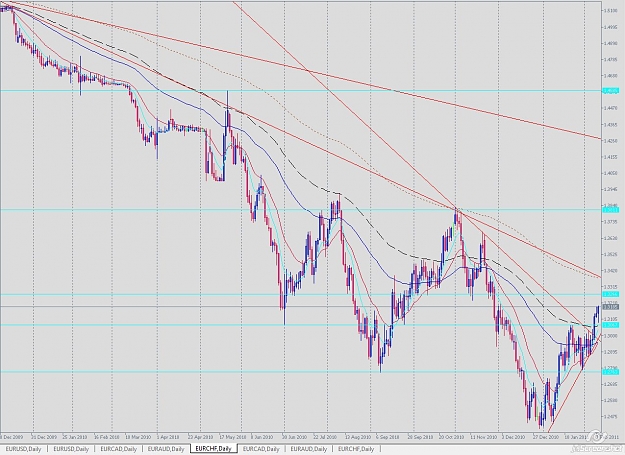
OK, question... Eur/chf and gbp chf have HH,HL on the daily, not in the weekly, so we looking to short, correct? They both have broken trendlines. Sorry, g/j is in the same boat. The rest of the gbp x and eur x + yen seem to be headed that way. Or ...
Strat's Long Term Stress Free Trading
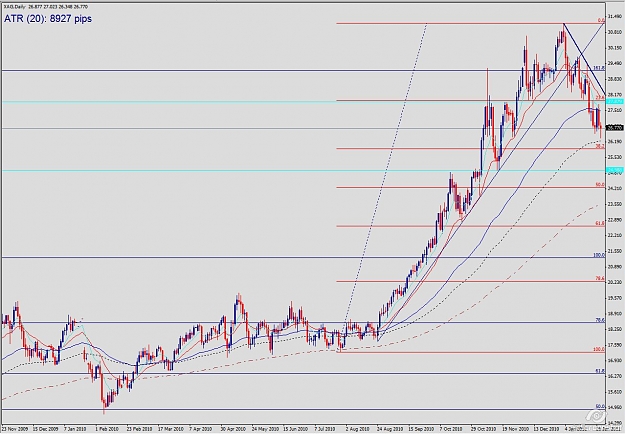
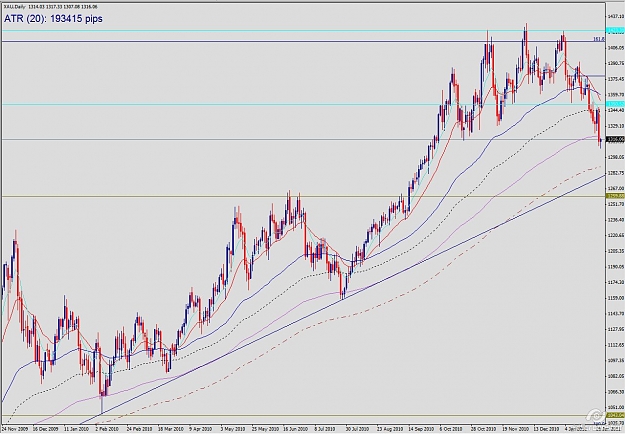
- Spinner replied Jan 28, 2011
So what's up with silver? Anybody need a cheap silver pendant for the girl friend? Or do we want it in gold and cheaper? Whole planet is looking at these charts...Chinese, Indians, Russians, Dentists, Jewellers.....
Strat's Long Term Stress Free Trading
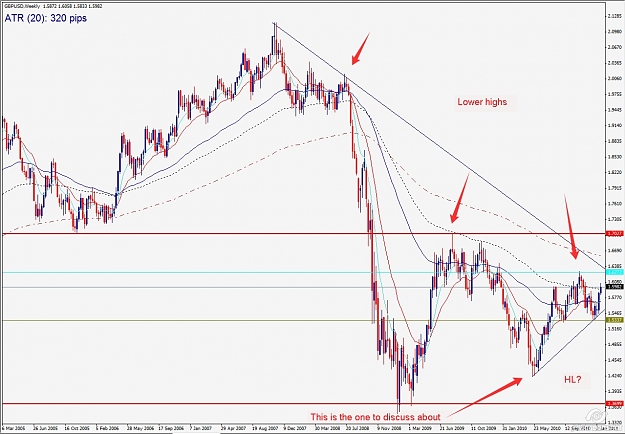
- Spinner replied Jan 20, 2011
Maybe you're making HH andLL etc in the daily but marking them on the weekly. My weekly looks a bit like this one
Strat's Long Term Stress Free Trading
- Spinner replied Nov 28, 2010
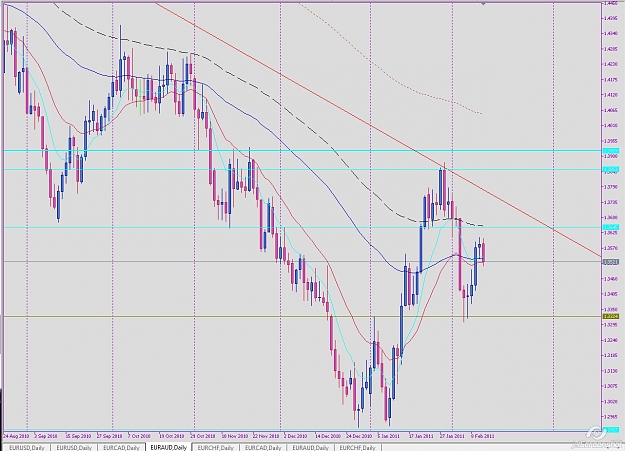
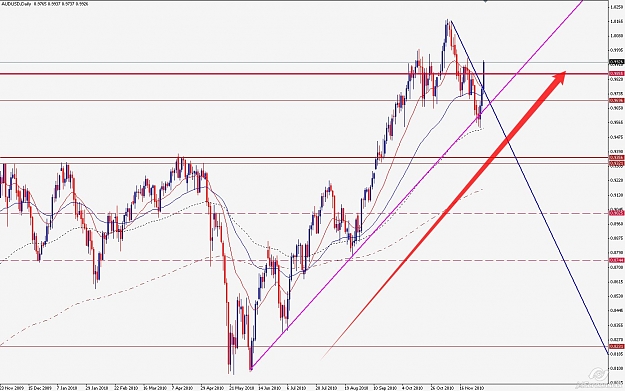
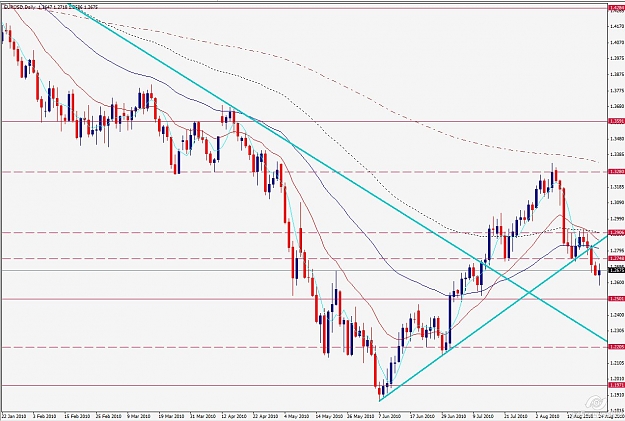
That 1.37 area has resistance>>trendline retest>>50% fibo of the last movement. So that could be a nice short with a small sl
Strat's Long Term Stress Free Trading
- Spinner replied Aug 24, 2010
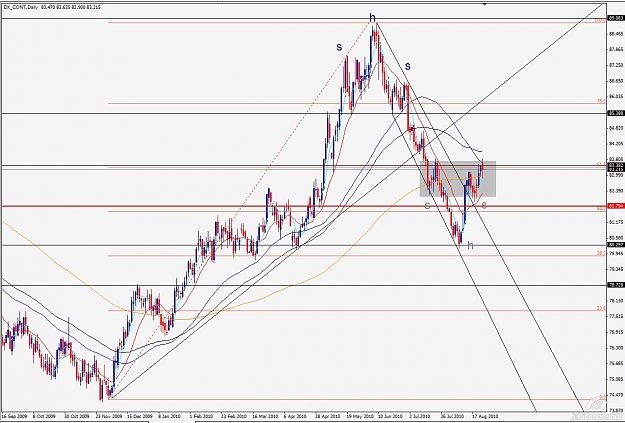
Clustering — Usdx at a point where it has two fibos a wee resistance and dealing with the 50. Weekly was a nice bullish candle. And we have a shs pattern upside down. Interesting hey!
Strat's Long Term Stress Free Trading
- Spinner replied Aug 24, 2010
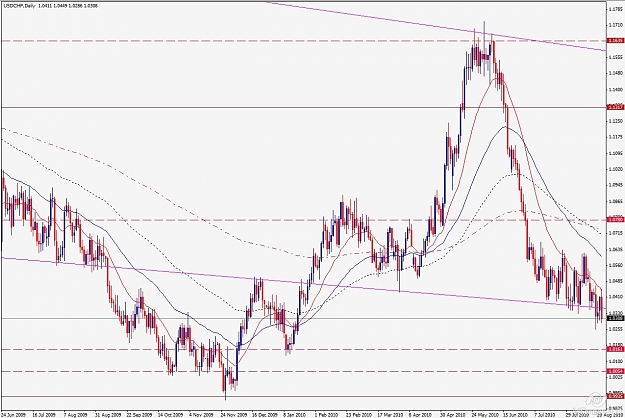
The other side of the road — Swissie has a BEEB if it closes around here. I will be sleeping....
Strat's Long Term Stress Free Trading
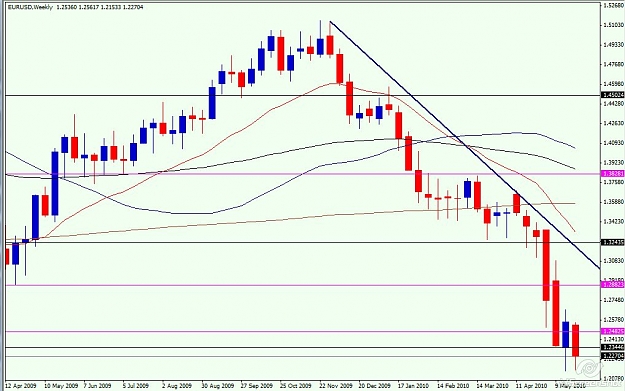
- Spinner replied Aug 24, 2010
Euro retest — Euro back top the line in the sand. What will it do? If one had taken the bottom of the weekly BEEB this would bring one back to zero or maybe another chance to get in? we'll see.
Strat's Long Term Stress Free Trading
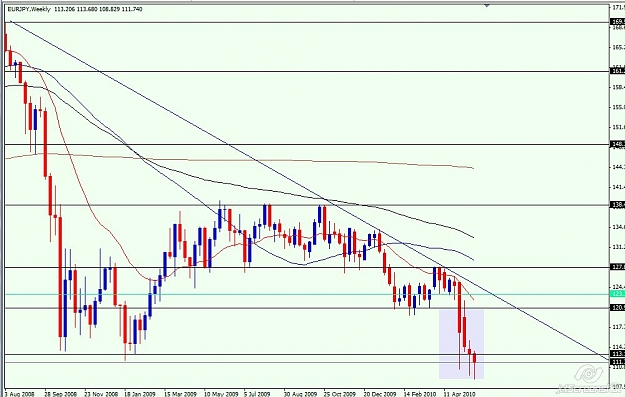
- Spinner replied Jun 19, 2010
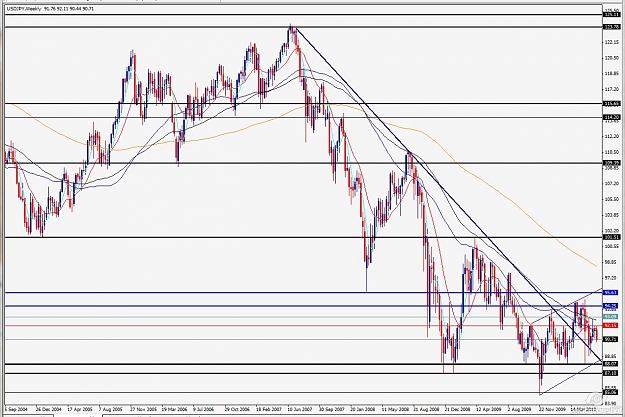
Japanese Madness — Don't quite know if these three last weekly candles are tradeable. First one rejected by the 100. Second does a hanging man which is engulfed by the last bearish candle. 88 (and bottom of up channel) and 87 would be targets. ...
Strat's Long Term Stress Free Trading
- Spinner replied Jun 3, 2010
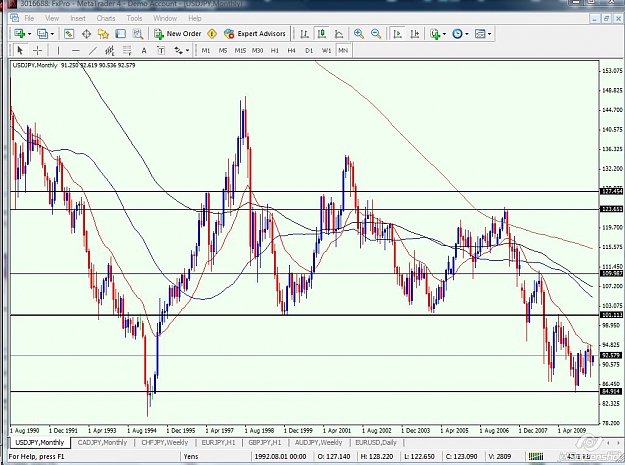
Moving the average — Not that we have incorporated moving averages into the equation of the Yen, I look and see the "rubber band effect" in the monthly, though I have seen it stronger. That lovely dance that price plays with them.
Strat's Long Term Stress Free Trading
- Spinner replied May 29, 2010
Euro inside out, outside in... — And E/j has grown a third leg!!
Strat's Long Term Stress Free Trading