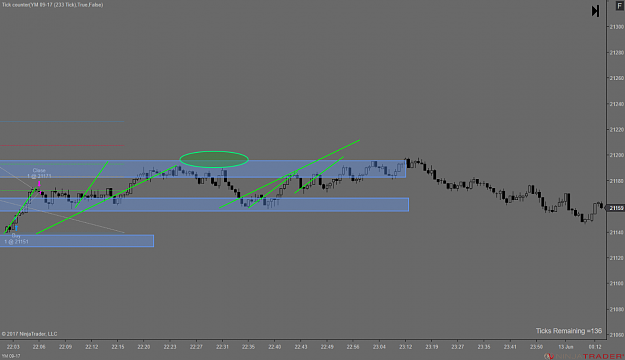
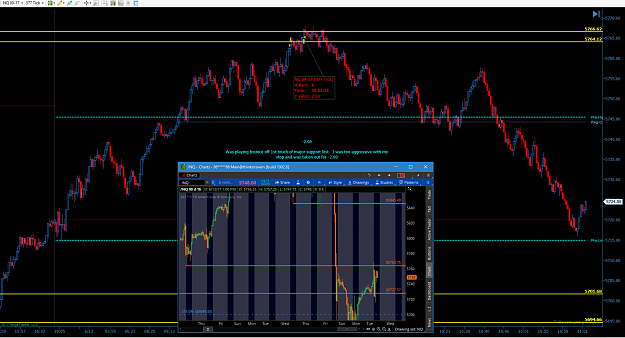
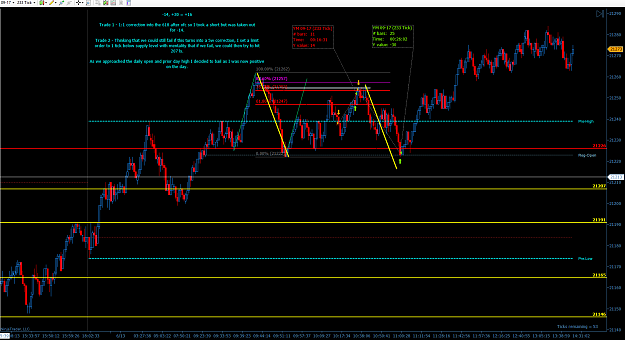
NQ +14.25 Took trigger off 512tk chart after we held pivot and reclaimed the open. Large sell bar / momentum was negated right away by buying.
Ignored
Nice trades on NQ. I was wondering is there any reason why you use TOS? It's reputed for having low resolution tick datas. You know that you can open more than one chart with NT, don't you? ;-)
{quote} Nice trade. There was a good level there to play, 6pts of risk for max 24pts profit on that move: {image}
Ignored
It was 15 PIPs of risk for me. Therefore 20PIPs of profit was still a good R:R. Was reading more on the Order flow and ratios for entries. Could not find confluence of the harmonics.
Left another good trade on the table cos I was too tired and had to turn in early...PA did come into my AOI just after I closed for the day.....
This had better confluence of the golden ratio, BRN, harmonics of the 1 to 1 completion and weakening of the bulls into my AOI.
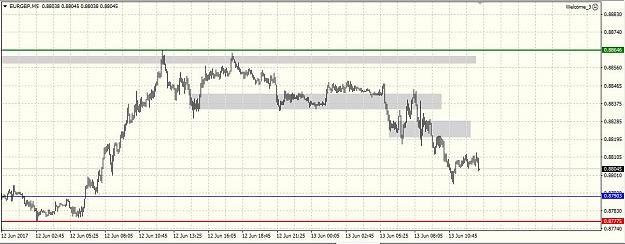
First of all, i'd like to thank you for this thread. it's been amazing learning from your youtube videos and thread..i spent 3 hours everyday looking at how you trade and how you place your trades and exit them. I've been making more losses than profits, however, i'm trading currency pairs and only look at 2 at the moment on a MT4 platform- EURGBP and USDJPY both on the 5 min chart. Needed to understand what you see in this situation and plz do correct me wherever necessary.
This is my outlook:
Long term: I go to a H1 chart and it is a bullish outlook
Intraday term: this is where i'm confused...I'm using the long swing on the left as NSH and if it is broken (red line). It's a very long swing and anything between makes it vunerable to take a trade if my stop needs to be below it
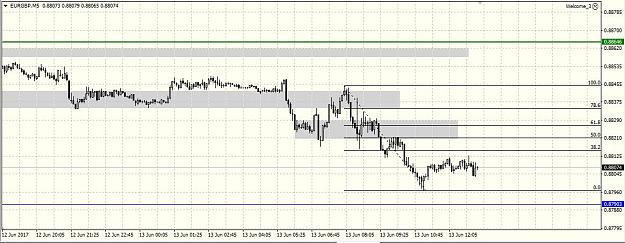
Short term: market is bearish as seen on 2nd attachment
My question is that the market looks bearish and there is an opportunity to go short if the market visits the area of interest, however the long term and intraday is bullish. How should i approach this trade and please let me know if i was right on intraday standpoint
Hi Mr. Pip, First of all, i'd like to thank you for this thread. it's been amazing learning from your youtube videos and thread..i spent 3 hours everyday looking at how you trade and how you place your trades and exit them. I've been making more losses than profits, however, i'm trading currency pairs and only look at 2 at the moment on a MT4 platform- EURGBP and USDJPY both on the 5 min chart. Needed to understand what you see in this situation and plz do correct me wherever necessary. This is my outlook: Long term: I go to a H1 chart and it is...
Ignored
Hey RajD,
Mr Pip has been a little absent of late so thought I would chime in with my thoughts
Your question depends on the type of trader you are? Are you intra day trading (getting in and out of trades in the same day, mostly within an hour or 2, or are you a swing trader, trading over a few days. The later means you trade with larger stops but the gains on the winning trades are bigger. Most of people on here are intra day traders.
So the first chart you showed should be used to help you mark levels of support/resistance, these assist you in where price may react when it reaches those areas. Then the second chart would be my graph to trade from, so yes I would be looking for shorts there.
Have you been through the whole of the thread? Or at least from the link on post 1? All the info is here to give you all the info you need to trade like this, that said we have all needed that extra bit of guidance to get us on the correct path.
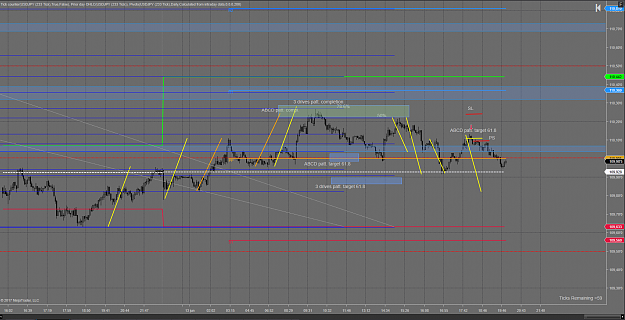
It was a nice day for harmonic patterns on the USDJPY.
There was an ABCD (orange) completion this morning (my time), at 78.6% correction of longer term swing. Unfortunately I didn't have time to manage the trade so I didn't take it. It hit the 61.8% target.
Now hoping to complete 61.8% target of a three drives pattern or maybe a 1:1 of the previous swing down.
Entry was taken after the 61.8% correction (a bit more) of an ABCD pattern completion, at structure.
Moved SL to BE, riskfree trade.
How do you guys decide on the count for the tick chart?
It looks like most of you use 233 for YM, 377 for NQ.
I want to look at GC. I'm looking for a good candidate for evening trades for pacific time. I would guess that volume for US equities would be kind of low. Its up in the air which would behave better, forex or a commodity like GC or CL.
{quote} Hey RajD, Mr Pip has been a little absent of late so thought I would chime in with my thoughts Your question depends on the type of trader you are? Are you intra day trading (getting in and out of trades in the same day, mostly within an hour or 2, or are you a swing trader, trading over a few days. The later means you trade with larger stops but the gains on the winning trades are bigger. Most of people on here are intra day traders. So the first chart you showed should be used to help you mark levels of support/resistance, these assist...
Ignored
Hi Pip Trendz,
I keep confusing myself on the intraday and short term. I just started following the thread a few weeks ago and i've been watching all the videos of damian from youtube. However i use a mt4 platform and trade currency pairs. If it's ok ill be posting my trades as well. Been in a string of losses for the past 3 weeks and it's killing me, however, i feel it's only a matter of time i get a hang of it...most of my losses come from expectation failure and it seems like i'm always on the last stop of each trade haha..however, i need to let price come to me and i've missed many good trades as well...anyways thank you pip trendz and if anyone is trading forex, wouldn't mind sharing notes and rules on possible entries and exits.
It was a nice day for harmonic patterns on the USDJPY. There was an ABCD (orange) completion this morning (my time), at 78.6% correction of longer term swing. Unfortunately I didn't have time to manage the trade so I didn't take it. It hit the 61.8% target. Now hoping to complete 61.8% target of a three drives pattern or maybe a 1:1 of the previous swing down. Entry was taken after the 61.8% correction (a bit more) of an ABCD pattern completion, at structure. Moved SL to BE, riskfree trade. {image}
Ignored
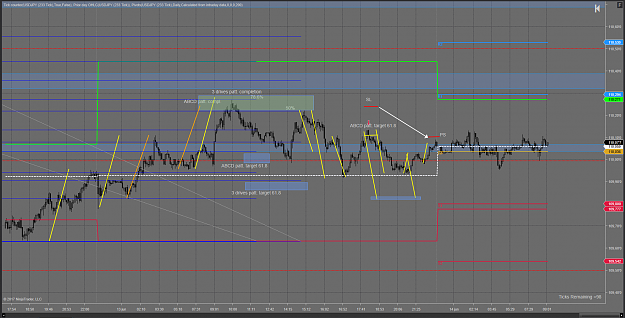
Bears started to weaken a little bit, couldn't make a NSL and price worked towards my protective stop.
I could have taken profit when I saw the first sign of weakness of the bears but I decided to let the trade run and go to sleep.
PS was hit somewhere in Asian session.
Out at BE.
Right now we're in a long complex correction.
Waiting for another opportunity..
{quote} Bears started to weaken a little bit, couldn't make a NSL and price worked towards my protective stop. I could have taken profit when I saw the first sign of weakness of the bears but I decided to let the trade run and go to sleep. PS was hit somewhere in Asian session. Out at BE. Right now we're in a long complex correction. Waiting for another opportunity.. {image}
Ignored
Hi PeterT,
When do you start trading on the USDJPY??.if you dont mind i would like to go thru my analysis with you...I'm currently trading EURGBP and USDJPY...Do let me know your thoughts.
{quote} Hi PeterT, When do you start trading on the USDJPY??.if you dont mind i would like to go thru my analysis with you...I'm currently trading EURGBP and USDJPY...Do let me know your thoughts. Thanks, Raj
Ignored
Hi RajD
I don't mind sharing thoughts but keep in mind that I am a student and not an expert.
There are other people on this thread that you can learn much more from.
I landed in this thread a few months ago and started reading and watching Mr. Pip's videos.
Those videos are gold. Watch them more than once.
Make sure you (or at least try to) really understand the method in every aspect by watching the lessons.
Then watch the live streams, they are of tremendous value.
After a few months I started posting to this thread.
The advise and directions of the members of this thread added even more value.
Everyone is willing to help, as long as you also do the effort of learning yourself.
I think the best way to learn (and to improve the chance of getting an answer ) is that you share your thoughts or your analysis and ask the thread members for their opinion, rather than asking what their thoughts are.
I'm not sure what you mean with the question about USDJPY.
I start trading at 9am my time, that's London open. Well actually I'm at work but I'm watching the chart and sometimes take a trade.
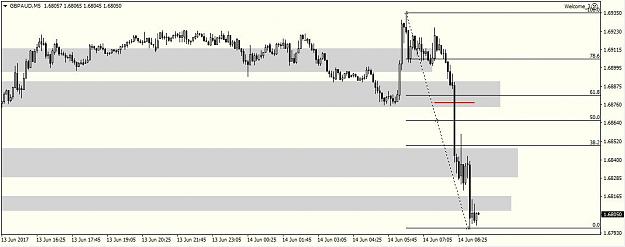
Looking at the GBPAUD 5 min chart. My analysis for this trade
Long Term: Bearish
Intraday: Bearish
Short term: Bearish
The red line is the expectation failure to a NSL as the intraday expectation was a NSH and it failed because of the GBP Avg Earning news that took place 45 min ago.
In order for me to take this trade on a R/R standpoint, price needs to come to my AOI near the 61.8 Fib area. Will update on any developments
If anyone looking at this chart differently or see better entries, do let me know
I took the same short trade (your second trade yesterday which gave you +30). However, I bailed out on the first swing down (test of previous low; white line on your chart). Do you have any special hint on how to determine when to stay in for the full move (as you did) and when to TP (as I did)?
Hope you know what I mean.
My reasoning for taking this trade was: We broke structure (low of your first line) and we had a 1:1 completion to the upside (point of entry short) => potential NSL (your second line).
Hi Traders, Looking at the GBPAUD 5 min chart. My analysis for this trade Long Term: Bearish Intraday: Bearish Short term: Bearish The red line is the expectation failure to a NSL as the intraday expectation was a NSH and it failed because of the GBP Avg Earning news that took place 45 min ago. In order for me to take this trade on a R/R standpoint, price needs to come to my AOI near the 61.8 Fib area. Will update on any developments If anyone looking at this chart differently or see better entries, do let me know {image}
Ignored
My first thought is that looking at the momentum of the move, it might not correct back to the 61.8?
I think you should expect a shallower correction. And if you get a bad risk-reward it is probably best to wait.
I find such large moves hard to trade when you don't get a decent correction.
I might be wrong. Just my thoughts
grtz Peter
EDIT: I edited my original answer because I don't want to encourage you in taking trades from a shallow correction.
{quote} My first thought is that looking at the momentum of the move, it might not correct back to the 61.8? I think you should expect a shallower correction. Find one with structure to the left and fib ratio confluence and see if bulls weaken into your area of interest. I find such large moves hard to trade when you don't get a decent correction. I might be wrong. Just my thoughts grtz Peter
Ignored
totally agree with you peter, however, the only other trade i'm willing to take would be the first confirmation of the correction which is the 38.2 and there is structure there as well, however major support and resistance took place at 61.8. secondly, my stop loss would have to be way up at the 1.69295 so the R/R is atleast to the 1:1 ratio. so i guess i'm gonna wait for the 38.2 to 61.8. If not, ill watch it sail without me