Disliked{quote} Mastermind, I have tried to go back to basic Murrey and because I use 2 Brokers charts one that treats Sunday as a stand alone bar and one that adds it to Monday I have dismissed the time element of his work and just focused in Price so I am making an effort to get to grips with just putting price in the relevant trade frame, shown in powerpoint presentation I posted that I guess few have bothered to look at, from this I reducing it down in the correct manner to give me an Octave size that is both meaningful and tradable, if I can master...Ignored
For example on a pair I recently looked at but the name evades me at this time it was on a D1 Chart with the 64, 0 settings as per normal but multiple D1 candles showed a range as big as the octave gap, with many larger.
This makes entries a little interesting but what I did was simply try a different setting that fitted the general chart structure.
The setting was 64, 64......
Octave Gap was about 300 pips from memory.
TP hitting 2 octaves for 600 pips would be nice.
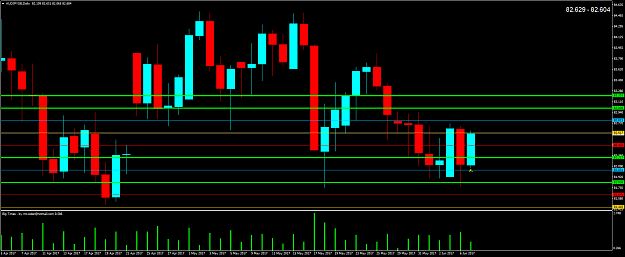
Anyway, I also notice several emerging and repeatable patterns on a Quad Formation.
If 2 red D1 candles complete with much larger ranges than the candles prior then look to go long on 2 smaller range blue candles.
Its like the bears have made 2 last final attempts to go lower but have exhausted themselves only to be taken over by the bulls.
The run in these types of setups has many hundreds of pips.
Plenty of examples in the charts.
Masterrmind..........
Master your Mind then Master your Trades