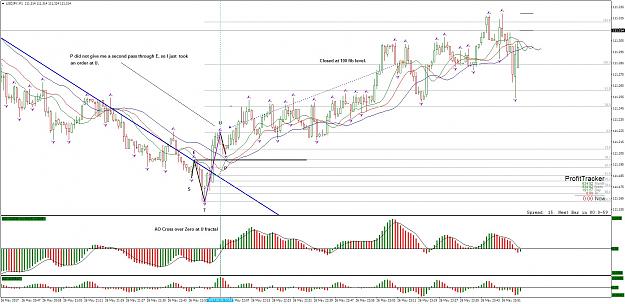
Dragos I was looking at the LTF drawing my T E lines and never even noticed that. Shows that you see what you are looking for. Good eye.
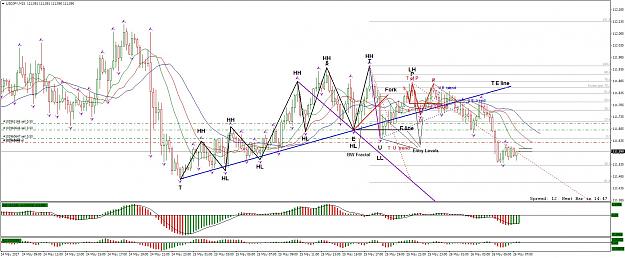
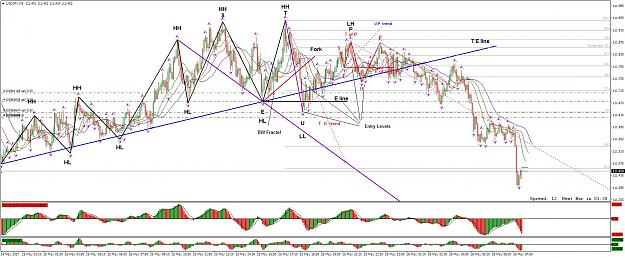
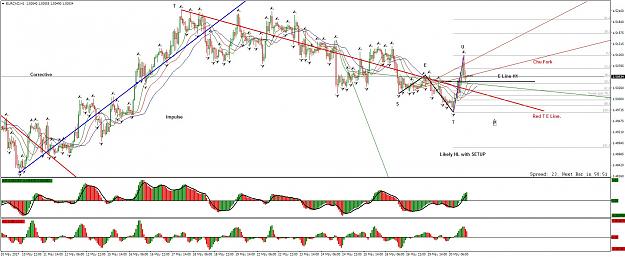
Mario, I deliberately left off the E lines to make people look a little harder. I have added them on on the next chart and also zoomed in because you need to be zoomed in enough to see the smaller structure within the large structure and you need to be zoomed out to see the larger structure.
When you can see the T E Line in blue and the E line in Black label as much of your SETUP as you can.
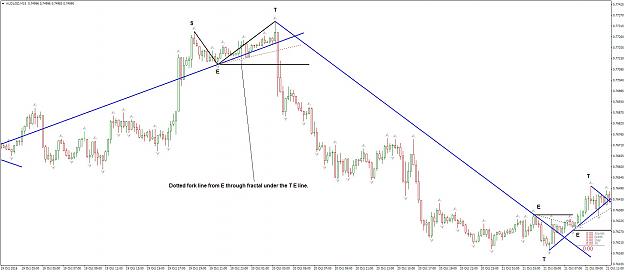
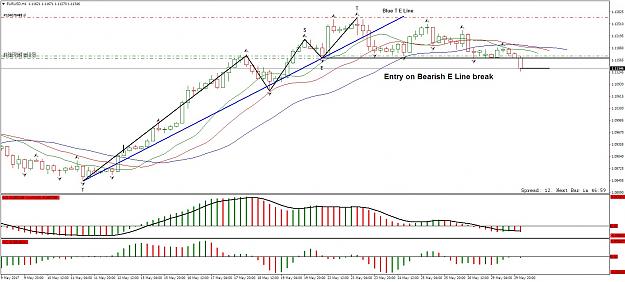
Here we have one of the T E lines and a bearish SETUP. The Blue T E line goes through E and I want to draw your attention to the fractal that pokes below the T E Line. Draw a line form E through that fractal and you have an early entry. This is my C Fork. (Again if you had a bullish SETUP you would reverse the process. The next chart will show a couple of those.)
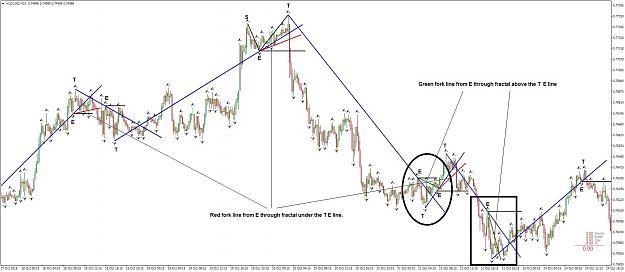
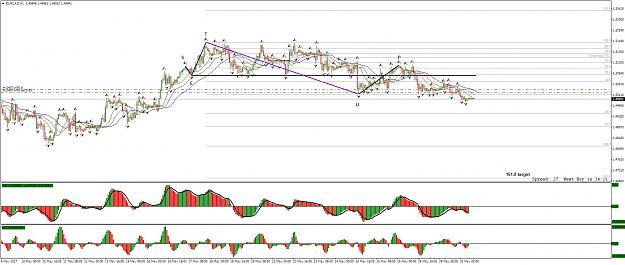
Here is the original T E line exercise chart with C Forks. Note that not every SETUP has a C Fork, The the last one on the bottom right is an example of one that doesn't.
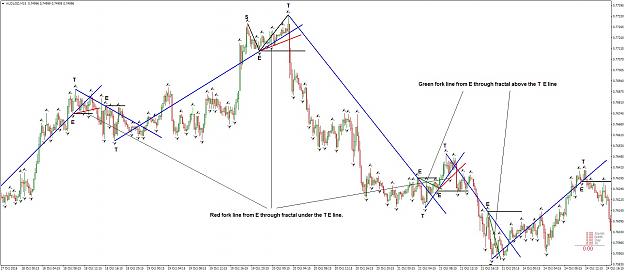
Bearish C Forks are shown with a red line, Bullish C Forks are shown with a green line.
There is a lot to absorb here. Go try it on a few charts at random and see how you do.
Locate a T.
Draw a line through the next E.
Look for a fractal under the T E line at a top or above the T E line if at a bottom.
Draw a line from E through that fractal. (Green for bullish and Red for bearish.)
After you do a few dozen or a few hundred it gets easy.
I am going to take a break now and let you play with this stuff. See how you do.
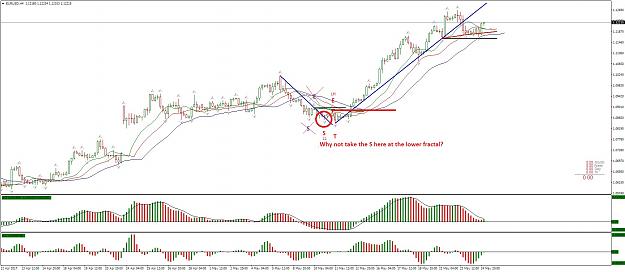
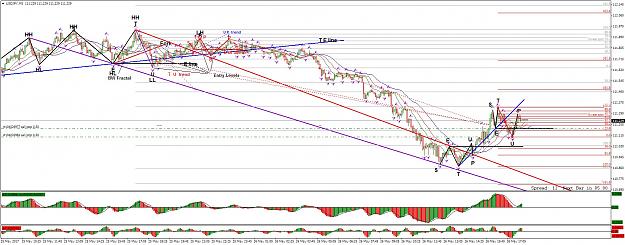
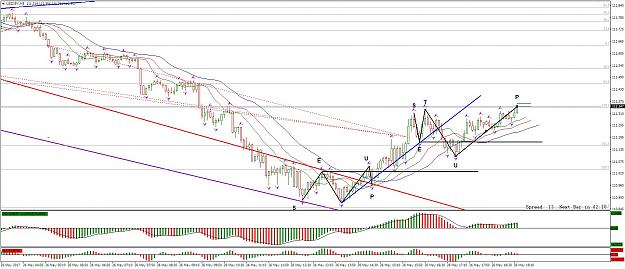
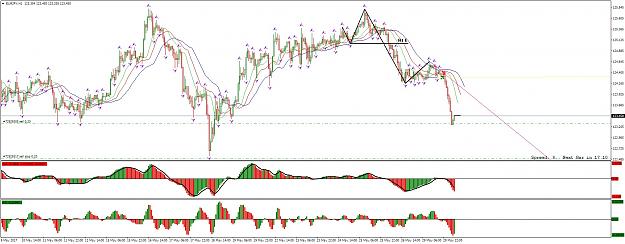
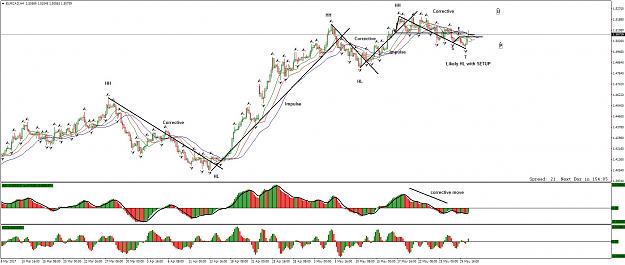
Here are couple more on the H4 EURUSD.

Mario, I deliberately left off the E lines to make people look a little harder. I have added them on on the next chart and also zoomed in because you need to be zoomed in enough to see the smaller structure within the large structure and you need to be zoomed out to see the larger structure.
When you can see the T E Line in blue and the E line in Black label as much of your SETUP as you can.
Attached Image (click to enlarge)
Here we have one of the T E lines and a bearish SETUP. The Blue T E line goes through E and I want to draw your attention to the fractal that pokes below the T E Line. Draw a line form E through that fractal and you have an early entry. This is my C Fork. (Again if you had a bullish SETUP you would reverse the process. The next chart will show a couple of those.)
Here is the original T E line exercise chart with C Forks. Note that not every SETUP has a C Fork, The the last one on the bottom right is an example of one that doesn't.
Attached Image (click to enlarge)
Bearish C Forks are shown with a red line, Bullish C Forks are shown with a green line.
There is a lot to absorb here. Go try it on a few charts at random and see how you do.
Locate a T.
Draw a line through the next E.
Look for a fractal under the T E line at a top or above the T E line if at a bottom.
Draw a line from E through that fractal. (Green for bullish and Red for bearish.)
After you do a few dozen or a few hundred it gets easy.
I am going to take a break now and let you play with this stuff. See how you do.
Here are couple more on the H4 EURUSD.
Attached Image (click to enlarge)